IT Managers and Directors · 1–31 October 2026
All-ad base: 272. Without recorded skills: 0.
Updated 19 November 2026 · Lightcast · Latest figures
Monthly report published · Validated refresh 19 November 2026
These figures use the latest validated refresh. The official monthly reports keep their figures as published.
Observed postings through 17 November 2026. Source completeness is unconfirmed. Daily website refresh is separate from monthly editorial publication. IT Managers and Directors is Lightcast’s IT Manager / Director occupation. It contains four specialised occupations: IT Manager, Technical Manager / Director, IT Operations / Networking Manager and IT Director.
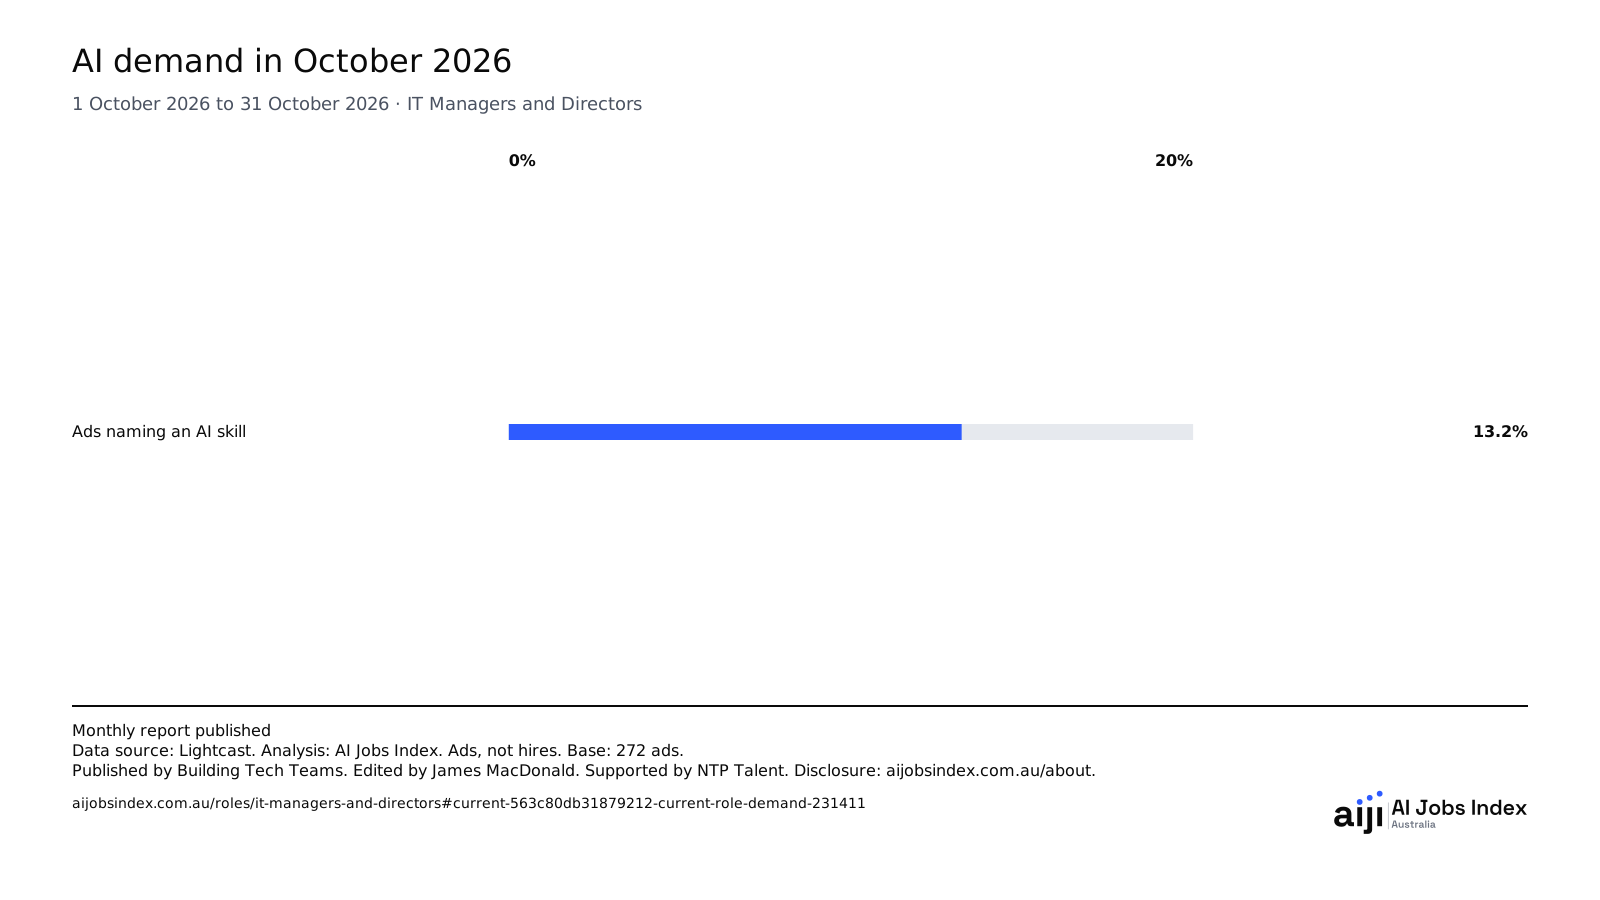
Share of ads with a recorded AI skill in October 2026
13.2%October 2026. Data source: Lightcast.
IT Managers and Directors is Lightcast’s IT Manager / Director occupation. It contains four specialised occupations: IT Manager, Technical Manager / Director, IT Operations / Networking Manager and IT Director.
Read the supporting evidence →01
13.2% of IT Managers and Directors job ads named an AI skill in October 2026.
IT Managers and Directors job ads. October 2026. Data source: Lightcast.
| Entry | Reading and base |
|---|---|
| Ads naming an AI skill | 13.2% 36 of 272 job ads |
IT Managers and Directors is Lightcast’s IT Manager / Director occupation. It contains four specialised occupations: IT Manager, Technical Manager / Director, IT Operations / Networking Manager and IT Director.
Percentages use all job ads for this occupation in the displayed period.
Citation
AI Jobs Index Australia. AI demand in October 2026. IT Managers and Directors. Period: 1 October 2026 to 31 October 2026. Validated refresh 19 November 2026. Accessed 20 November 2026. Data source: Lightcast. Observed postings through 17 November 2026. Source delivery 19 November 2026. Published by Building Tech Teams. https://www.aijobsindex.com.au/roles/it-managers-and-directors#current-563c80db31879212-current-role-demand-231411
36 AI-tagged / 272 all advertisements.
All-ad base: 272. Without recorded skills: 0.
IT Manager 1,673, Technical Manager / Director 654, IT Operations / Networking Manager 608, IT Director 300. Last 12 months, finishing October 2026. Data source: Lightcast.
02
Month-on-month change · +13.8%
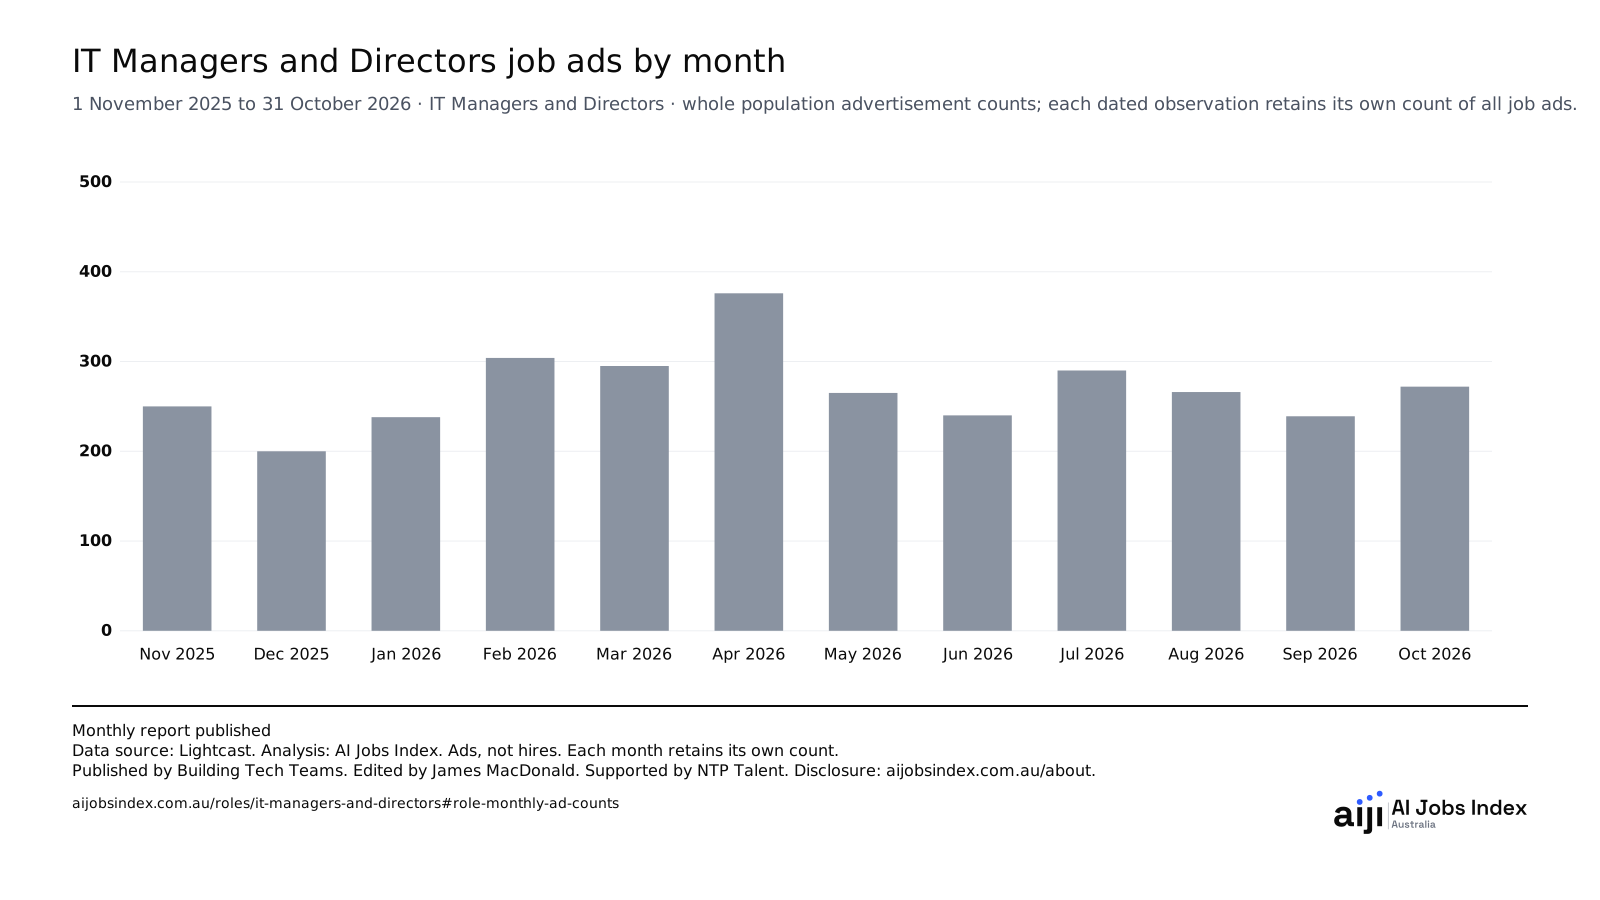
In October 2026, 272 job ads were recorded.
Last 12 months, finishing October 2026. Data source: Lightcast.
| Entry | Reading and base |
|---|---|
| November 2025 | 250 Distinct advertisement count · 1 November 2025 to 30 November 2025 |
| December 2025 | 200 Distinct advertisement count · 1 December 2025 to 31 December 2025 |
| January 2026 | 238 Distinct advertisement count · 1 January 2026 to 31 January 2026 |
| February 2026 | 304 Distinct advertisement count · 1 February 2026 to 28 February 2026 |
| March 2026 | 295 Distinct advertisement count · 1 March 2026 to 31 March 2026 |
| April 2026 | 376 Distinct advertisement count · 1 April 2026 to 30 April 2026 |
| May 2026 | 265 Distinct advertisement count · 1 May 2026 to 31 May 2026 |
| June 2026 | 240 Distinct advertisement count · 1 June 2026 to 30 June 2026 |
| July 2026 | 290 Distinct advertisement count · 1 July 2026 to 31 July 2026 |
| August 2026 | 266 Distinct advertisement count · 1 August 2026 to 31 August 2026 |
| September 2026 | 239 Distinct advertisement count · 1 September 2026 to 30 September 2026 |
| October 2026 | 272 Distinct advertisement count · 1 October 2026 to 31 October 2026 |
IT Managers and Directors is Lightcast’s IT Manager / Director occupation. It contains four specialised occupations: IT Manager, Technical Manager / Director, IT Operations / Networking Manager and IT Director.
Each month uses its own count of job ads. The table shows the dates and any months without a published figure. Month-on-month change in job ads +13.8% (1 October 2026 to 31 October 2026 versus 1 September 2026 to 30 September 2026).
Citation
AI Jobs Index Australia. IT Managers and Directors job ads by month. IT Managers and Directors · whole population advertisement counts; each dated observation retains its own count of all job ads. Period: 1 November 2025 to 31 October 2026. Validated refresh 19 November 2026. Accessed 20 November 2026. Data source: Lightcast. Observed postings through 17 November 2026. Source delivery 19 November 2026. Published by Building Tech Teams. https://www.aijobsindex.com.au/roles/it-managers-and-directors#role-monthly-ad-counts
Job ads in full calendar months.
* Based on a small sample. Use with caution.
All-ad base: 250. Without recorded skills: 1*.
All-ad base: 200. Without recorded skills: 2*.
All-ad base: 238. Without recorded skills: 1*.
All-ad base: 304. Without recorded skills: 2*.
All-ad base: 295. Without recorded skills: 9*.
All-ad base: 376. Without recorded skills: 2*.
All-ad base: 265. Without recorded skills: 0.
All-ad base: 240. Without recorded skills: 0.
All-ad base: 290. Without recorded skills: 0.
All-ad base: 266. Without recorded skills: 0.
All-ad base: 239. Without recorded skills: 0.
All-ad base: 272. Without recorded skills: 0.
03
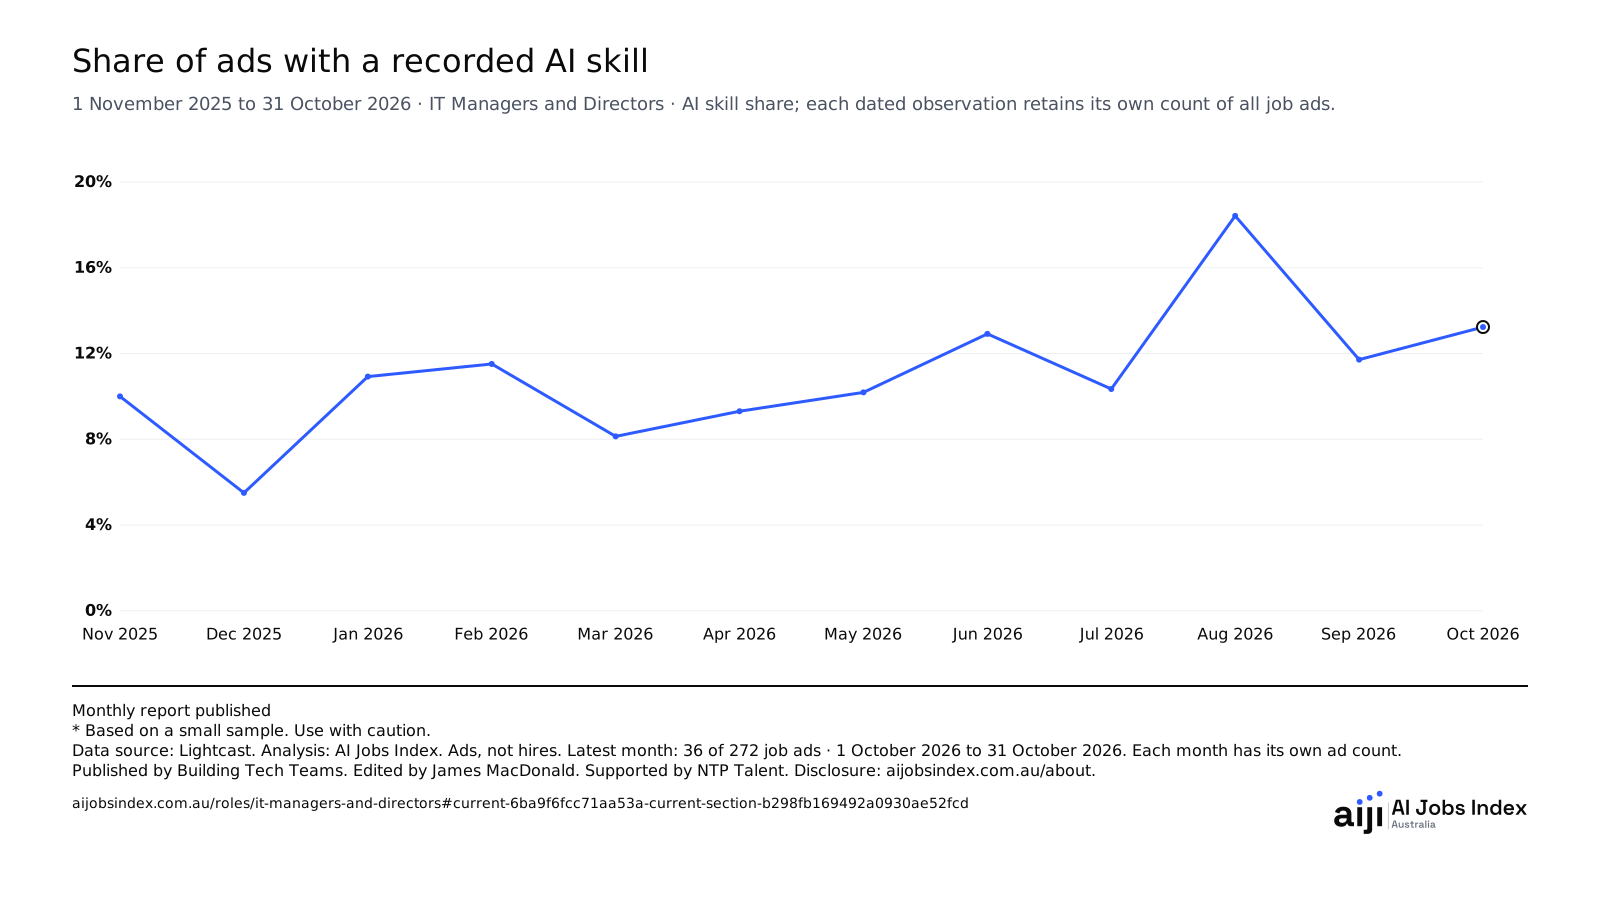
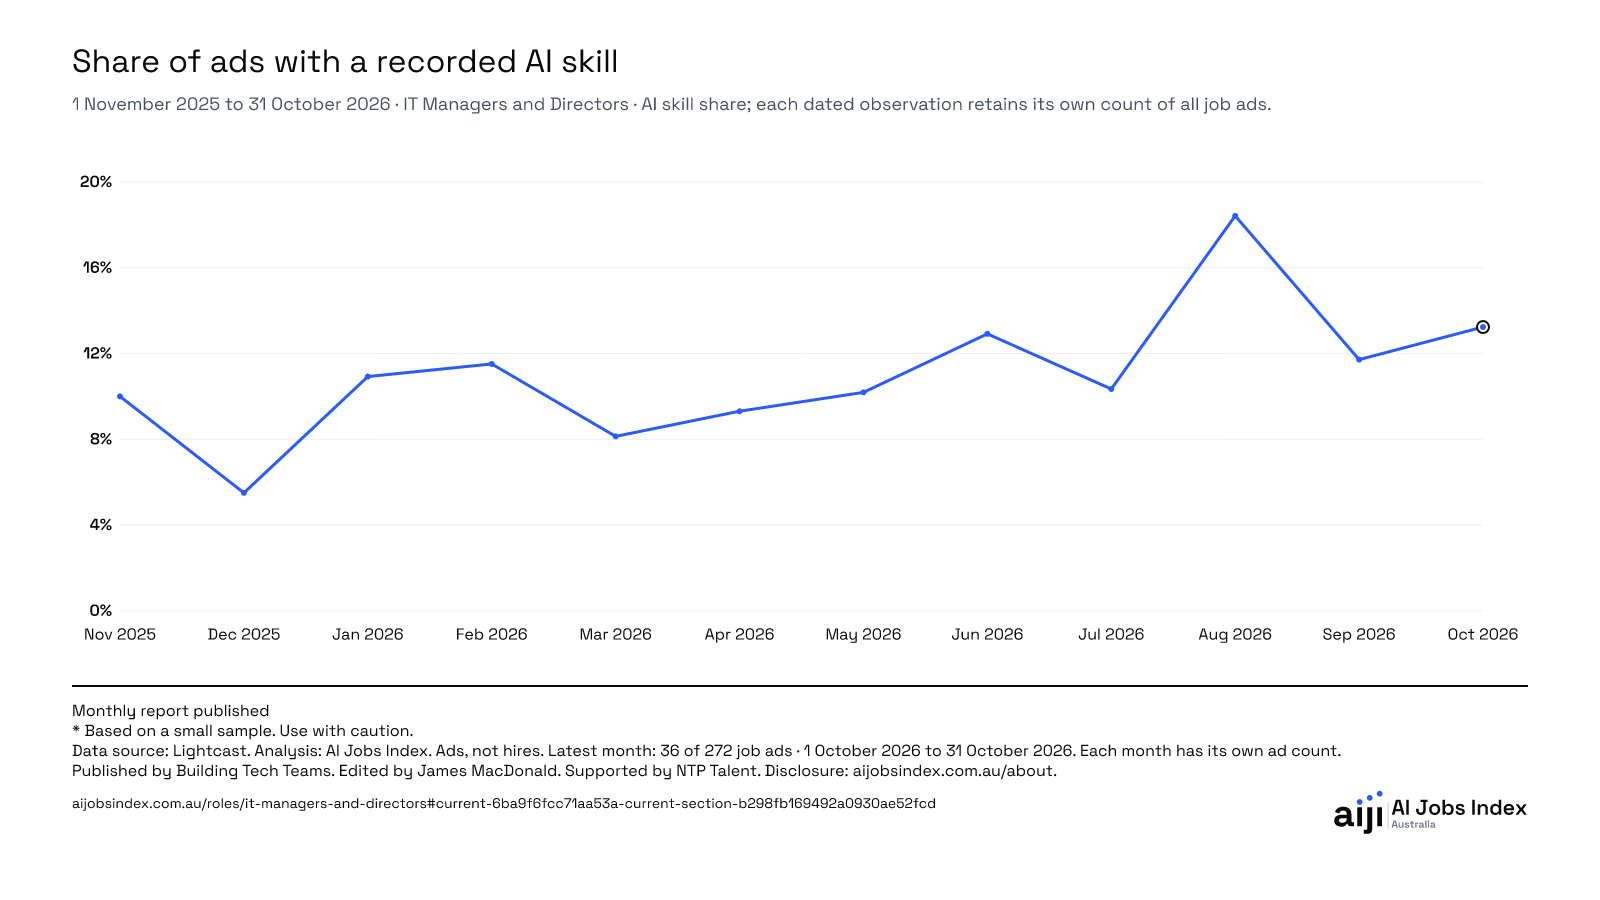
13.2% of IT Managers and Directors job ads named an AI skill in October 2026.
Last 12 months, finishing October 2026. Data source: Lightcast.
* Based on a small sample. Use with caution.
| Entry | Reading and base |
|---|---|
| November 2025 | 10.0%* 25 of 250 job ads · 1 November 2025 to 30 November 2025 |
| December 2025 | 5.5%* 11 of 200 job ads · 1 December 2025 to 31 December 2025 |
| January 2026 | 10.9%* 26 of 238 job ads · 1 January 2026 to 31 January 2026 |
| February 2026 | 11.5% 35 of 304 job ads · 1 February 2026 to 28 February 2026 |
| March 2026 | 8.1%* 24 of 295 job ads · 1 March 2026 to 31 March 2026 |
| April 2026 | 9.3% 35 of 376 job ads · 1 April 2026 to 30 April 2026 |
| May 2026 | 10.2%* 27 of 265 job ads · 1 May 2026 to 31 May 2026 |
| June 2026 | 12.9% 31 of 240 job ads · 1 June 2026 to 30 June 2026 |
| July 2026 | 10.3% 30 of 290 job ads · 1 July 2026 to 31 July 2026 |
| August 2026 | 18.4% 49 of 266 job ads · 1 August 2026 to 31 August 2026 |
| September 2026 | 11.7%* 28 of 239 job ads · 1 September 2026 to 30 September 2026 |
| October 2026 | 13.2% 36 of 272 job ads · 1 October 2026 to 31 October 2026 |
* Based on a small sample. Use with caution.
IT Managers and Directors is Lightcast’s IT Manager / Director occupation. It contains four specialised occupations: IT Manager, Technical Manager / Director, IT Operations / Networking Manager and IT Director.
Each month uses its own count of job ads. The table shows the dates and any months without a published figure.
Citation
AI Jobs Index Australia. Share of ads with a recorded AI skill. IT Managers and Directors · AI skill share; each dated observation retains its own count of all job ads. Period: 1 November 2025 to 31 October 2026. Validated refresh 19 November 2026. Accessed 20 November 2026. Data source: Lightcast. Observed postings through 17 November 2026. Source delivery 19 November 2026. Published by Building Tech Teams. https://www.aijobsindex.com.au/roles/it-managers-and-directors#current-6ba9f6fcc71aa53a-current-section-b298fb169492a0930ae52fcd
Percentage of job ads naming an AI skill in each full calendar month.
All-ad base: 250. Without recorded skills: 1*.
All-ad base: 200. Without recorded skills: 2*.
All-ad base: 238. Without recorded skills: 1*.
All-ad base: 304. Without recorded skills: 2*.
All-ad base: 295. Without recorded skills: 9*.
All-ad base: 376. Without recorded skills: 2*.
All-ad base: 265. Without recorded skills: 0.
All-ad base: 240. Without recorded skills: 0.
All-ad base: 290. Without recorded skills: 0.
All-ad base: 266. Without recorded skills: 0.
All-ad base: 239. Without recorded skills: 0.
All-ad base: 272. Without recorded skills: 0.
04
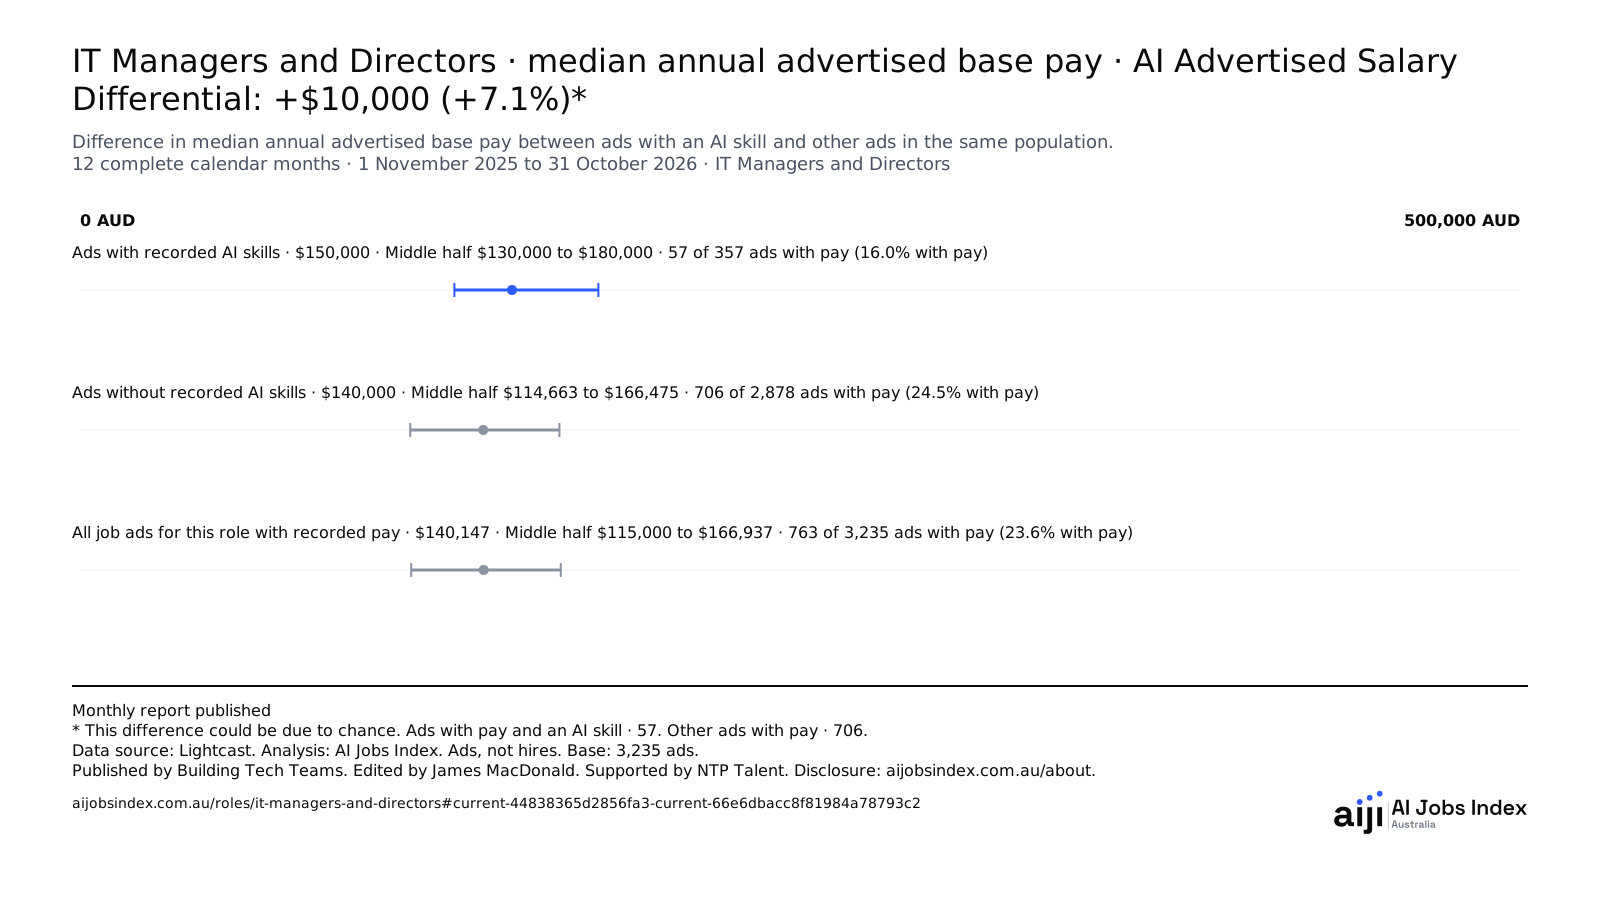
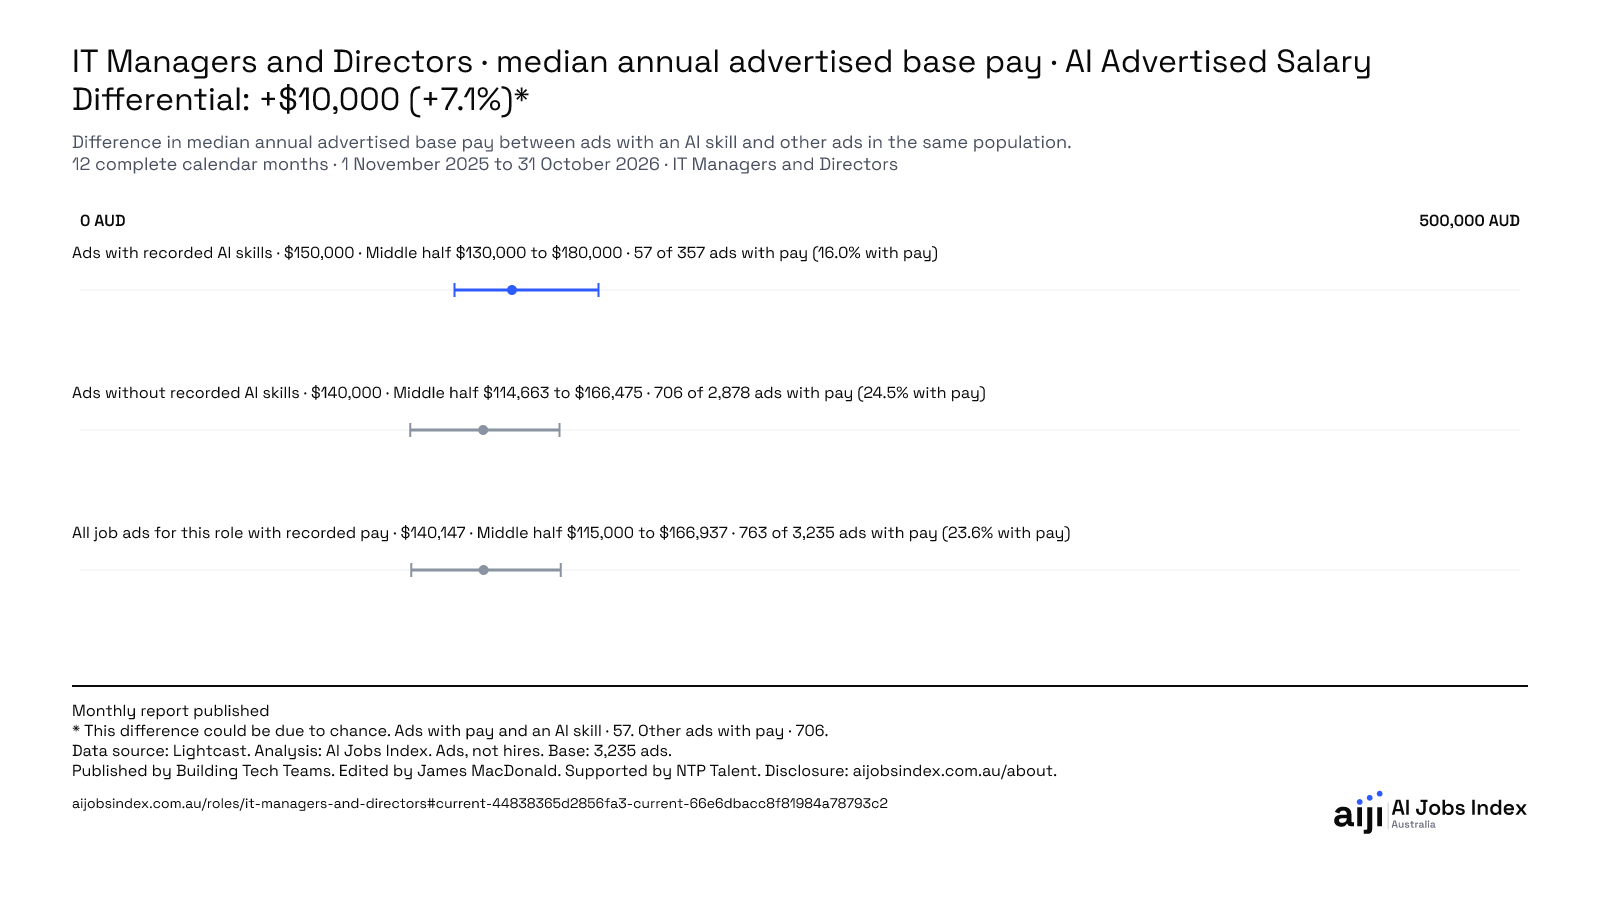
Median annual advertised base pay was $150,000 for ads naming an AI skill, $140,000 for other ads and $140,147 for all job ads for this role with recorded pay.
Last 12 months, finishing October 2026. Data source: Lightcast.
* This difference could be due to chance.
| Entry | Reading and base |
|---|---|
| Ads with recorded AI skills | $150,000 25th percentile: $130,000 · 75th percentile: $180,000 57 salary-bearing / 357 advertisements · 16.0% salary coverage |
| Ads without recorded AI skills | $140,000 25th percentile: $114,663 · 75th percentile: $166,475 706 salary-bearing / 2,878 advertisements · 24.5% salary coverage |
| All job ads for this role with recorded pay | $140,147 25th percentile: $115,000 · 75th percentile: $166,937 763 salary-bearing / 3,235 advertisements · 23.6% salary coverage |
IT Managers and Directors is Lightcast’s IT Manager / Director occupation. It contains four specialised occupations: IT Manager, Technical Manager / Director, IT Operations / Networking Manager and IT Director.
The range shows the middle half of annual advertised base pay. The filled dot marks the median. The end markers are offset so each value can be selected, even when the amounts are equal.
Each median uses only ads with recorded pay. Part-time figures show the annualised pay for the role as advertised. Differences can reflect the mix of jobs and seniority.
Exact dated population. Advertisements are not hires. Median annual advertised base pay in AUD excludes superannuation and benefits. Difference in median annual advertised base pay between ads with an AI skill and other ads in the same population. AI Advertised Salary Differential: +$10,000 (+7.1%). All ads with pay: 763. Ads with an AI skill and pay: 57. Other ads with pay: 706. Differences use the displayed whole-AUD medians. * This difference could be due to chance. The 95% confidence range is -$2,957 to +$25,000. The range includes zero. Fewer ads with pay or more variation in pay can widen the range.
Citation
AI Jobs Index Australia. IT Managers and Directors · median annual advertised base pay · AI Advertised Salary Differential: +$10,000 (+7.1%)*. IT Managers and Directors. Period: 12 complete calendar months · 1 November 2025 to 31 October 2026. Validated refresh 19 November 2026. Accessed 20 November 2026. Data source: Lightcast. Observed postings through 17 November 2026. Source delivery 19 November 2026. Published by Building Tech Teams. https://www.aijobsindex.com.au/roles/it-managers-and-directors#current-44838365d2856fa3-current-66e6dbacc8f81984a78793c2
Each median uses ads with recorded pay. Excludes superannuation and benefits.
The 95% confidence range is -$2,957 to +$25,000. The range includes zero. Fewer ads with pay or more variation in pay can widen the range.
| Cohort | Median | 25th percentile | 75th percentile | All ads | Ads with recorded pay | Salary coverage |
|---|---|---|---|---|---|---|
| With an AI skill | $150,000 | $130,000 | $180,000 | 357 | 57 | 16.0% |
| Other ads | $140,000 | $114,663 | $166,475 | 2,878 | 706 | 24.5% |
| All ads | $140,147 | $115,000 | $166,937 | 3,235 | 763 | 23.6% |
05
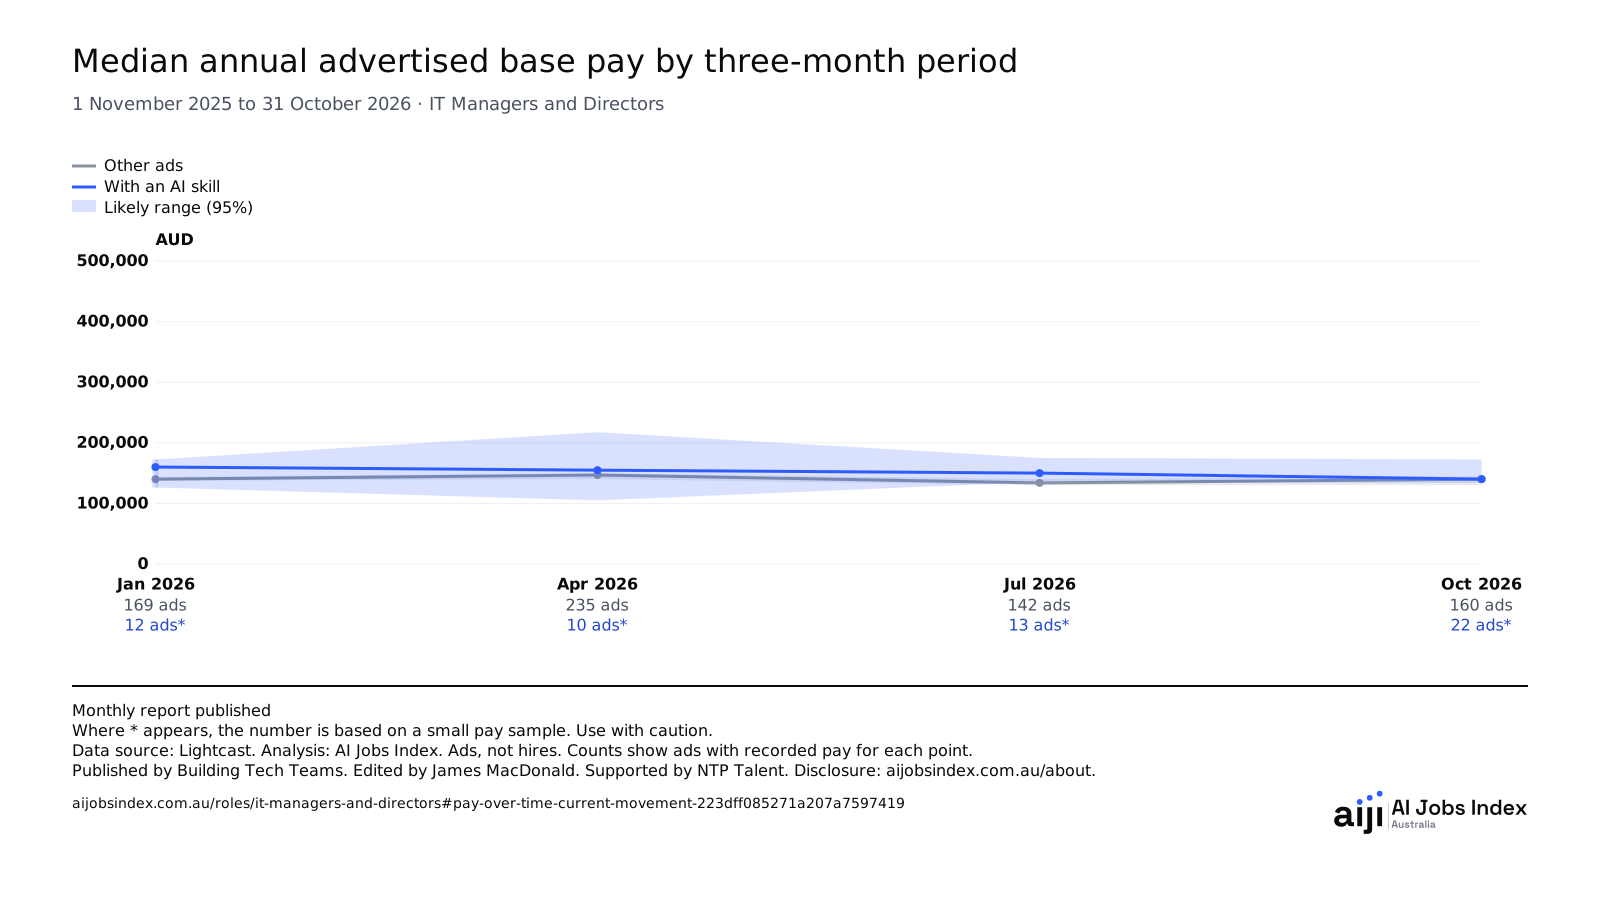
In the three months to October 2026, median annual advertised base pay was $140,000 for other ads and $140,073 for ads naming an AI skill.
Last 12 months, finishing October 2026. Data source: Lightcast.
Ads with pay below each date. First row: other ads. Second row: ads with an AI skill.
Where * appears, the number is based on a small pay sample. Use with caution.
| Entry | Reading and base |
|---|---|
| January 2026 | Other ads · $140,000 Likely range (95%): $137,280 to $143,738. 169 salary-bearing / 626 advertisements · 1 November 2025 to 31 January 2026 |
| April 2026 | Other ads · $146,849 Likely range (95%): $140,000 to $149,739. 235 salary-bearing / 881 advertisements · 1 February 2026 to 30 April 2026 |
| July 2026 | Other ads · $133,750 Likely range (95%): $130,000 to $140,000. 142 salary-bearing / 707 advertisements · 1 May 2026 to 31 July 2026 |
| October 2026 | Other ads · $140,000 Likely range (95%): $130,193 to $144,753. 160 salary-bearing / 664 advertisements · 1 August 2026 to 31 October 2026 |
| January 2026 | With an AI skill · $160,000 Likely range (95%): $126,252 to $172,500. Small pay sample. 12* salary-bearing / 62 advertisements · 1 November 2025 to 31 January 2026 |
| April 2026 | With an AI skill · $154,836 Likely range (95%): $105,000 to $217,500. Small pay sample. 10* salary-bearing / 94 advertisements · 1 February 2026 to 30 April 2026 |
| July 2026 | With an AI skill · $150,000 Likely range (95%): $135,628 to $175,000. Small pay sample. 13* salary-bearing / 88 advertisements · 1 May 2026 to 31 July 2026 |
| October 2026 | With an AI skill · $140,073 Likely range (95%): $133,522 to $172,500. Small pay sample. 22* salary-bearing / 113 advertisements · 1 August 2026 to 31 October 2026 |
IT Managers and Directors is Lightcast’s IT Manager / Director occupation. It contains four specialised occupations: IT Manager, Technical Manager / Director, IT Operations / Networking Manager and IT Director.
Each median uses only ads with recorded pay. Part-time figures show the annualised pay for the role as advertised. Differences can reflect the mix of jobs and seniority.
A small pay sample has 1 to 29 ads with recorded pay.
Each point reports its exact period and the number of ads with recorded pay. Likely range (95%) is the middle 95% of medians from 2,000 or more resamples with replacement.
Citation
AI Jobs Index Australia. Median annual advertised base pay by three-month period. IT Managers and Directors. Period: 1 November 2025 to 31 October 2026. Validated refresh 19 November 2026. Accessed 20 November 2026. Data source: Lightcast. Observed postings through 17 November 2026. Source delivery 19 November 2026. Published by Building Tech Teams. https://www.aijobsindex.com.au/roles/it-managers-and-directors#pay-over-time-current-movement-223dff085271a207a7597419
Separate from the 12-month lead. Four consecutive three-month blocks ending at the latest closed month.
* Based on a small sample. Use with caution.
06
October 2026. Data source: Lightcast.
No AI skills appear in the ranking for this occupation in this period.
The measured skills are listed alphabetically in Data and citation. The ranking requires at least 100 ads in the population and at least 30 ads naming a skill.
| Skill | Share and ad counts |
|---|---|
| Agentic AI | 0.4%* 1 naming this skill / 272 job ads |
| AI Adoption | 1.5%* 4 naming this skill / 272 job ads |
| AI Agents | 0.4%* 1 naming this skill / 272 job ads |
| Applications Of Artificial Intelligence | 0.7%* 2 naming this skill / 272 job ads |
| Artificial Intelligence (broad tag) | 8.8%* 24 naming this skill / 272 job ads |
| Artificial Intelligence For IT Operations (AIOps) | 0.4%* 1 naming this skill / 272 job ads |
| Artificial Intelligence Strategy | 1.1%* 3 naming this skill / 272 job ads |
| Artificial Intelligence Systems | 0.4%* 1 naming this skill / 272 job ads |
| ChatGPT | 0.7%* 2 naming this skill / 272 job ads |
| Claude AI | 1.8%* 5 naming this skill / 272 job ads |
| Conversational AI | 0.4%* 1 naming this skill / 272 job ads |
| Generative Artificial Intelligence | 1.1%* 3 naming this skill / 272 job ads |
| Intelligent Automation | 0.4%* 1 naming this skill / 272 job ads |
| Large Language Modeling | 0.4%* 1 naming this skill / 272 job ads |
| Machine Learning (broad tag) | 0.4%* 1 naming this skill / 272 job ads |
| Microsoft Copilot | 0.7%* 2 naming this skill / 272 job ads |
| OpenAI | 0.7%* 2 naming this skill / 272 job ads |
| Responsible AI | 1.1%* 3 naming this skill / 272 job ads |
* Based on a small sample. Use with caution.
Citation
AI Jobs Index Australia. AI skills for this occupation. IT Managers and Directors. Period: 1 October 2026 to 31 October 2026. Validated refresh 19 November 2026. Accessed 20 November 2026. Data source: Lightcast. Observed postings through 17 November 2026. Source delivery 19 November 2026. Published by Building Tech Teams. https://www.aijobsindex.com.au/roles/it-managers-and-directors#current-c3da53a80ec8101a
07
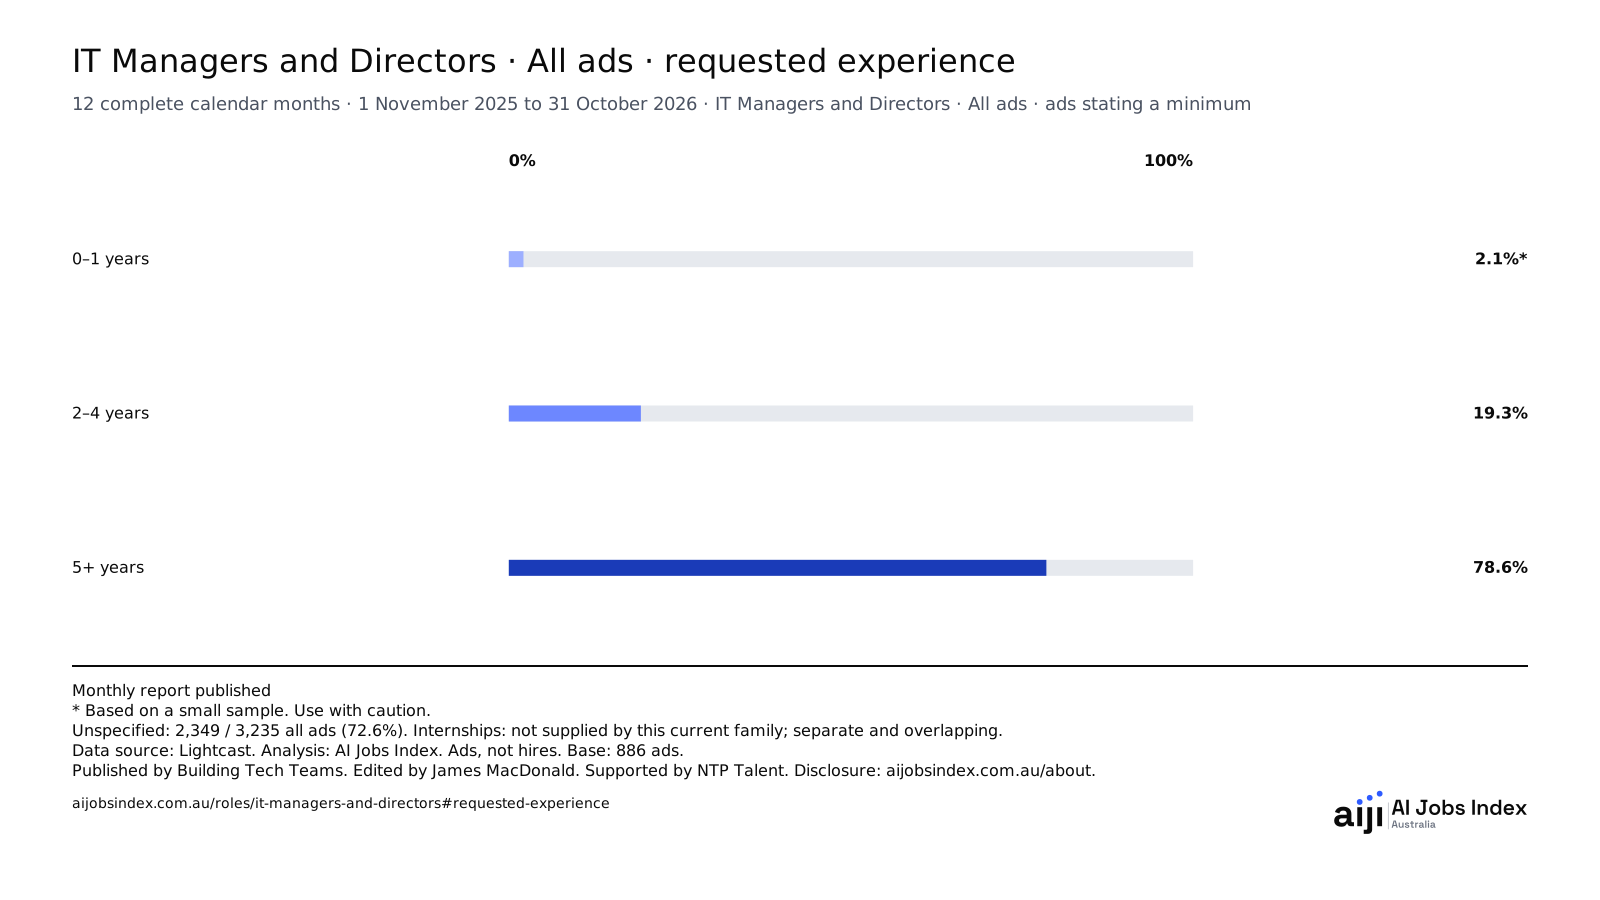
Of IT Managers and Directors ads that state a minimum, 78.6% asked for five or more years.
Last 12 months, finishing October 2026. Data source: Lightcast.
Shares use ads that state a minimum.
* Based on a small sample. Use with caution.
| Entry | Reading and base |
|---|---|
| 0–1 years | 2.1%* 19 of 886 job ads |
| 2–4 years | 19.3% 171 of 886 job ads |
| 5+ years | 78.6% 696 of 886 job ads |
* Based on a small sample. Use with caution.
IT Managers and Directors is Lightcast’s IT Manager / Director occupation. It contains four specialised occupations: IT Manager, Technical Manager / Director, IT Operations / Networking Manager and IT Director.
Ads stating a minimum experience requirement: 886. All job ads for this role and period: 3,235. Unspecified experience uses the separate count of all job ads: 2,349 / 3,235 advertisements (72.6%). Internships are not supplied by this current experience family; no count or share is inferred. Internships can overlap the bands and are not an additional partition.
Citation
AI Jobs Index Australia. IT Managers and Directors · All ads · requested experience. IT Managers and Directors · All ads · ads stating a minimum. Period: 12 complete calendar months · 1 November 2025 to 31 October 2026. Validated refresh 19 November 2026. Accessed 20 November 2026. Data source: Lightcast. Observed postings through 17 November 2026. Source delivery 19 November 2026. Published by Building Tech Teams. https://www.aijobsindex.com.au/roles/it-managers-and-directors#requested-experience
Percentages use ads stating a minimum experience requirement. Ads with unspecified experience are counted separately among all job ads for this role. Requested experience is not candidate experience.
Ads stating a minimum experience requirement: 886. All job ads for this role and period: 3,235. Unspecified experience uses the separate all-ad base: 2,349 / 3,235 advertisements (72.6%). Internships are not supplied by this current experience family; no count or share is inferred. Internships can overlap the bands and are not an additional partition.
| Category | Advertisements | Share of ads stating a minimum |
|---|---|---|
| 0–1 years | 19* | 2.1%* |
| 2–4 years | 171 | 19.3% |
| 5+ years | 696 | 78.6% |
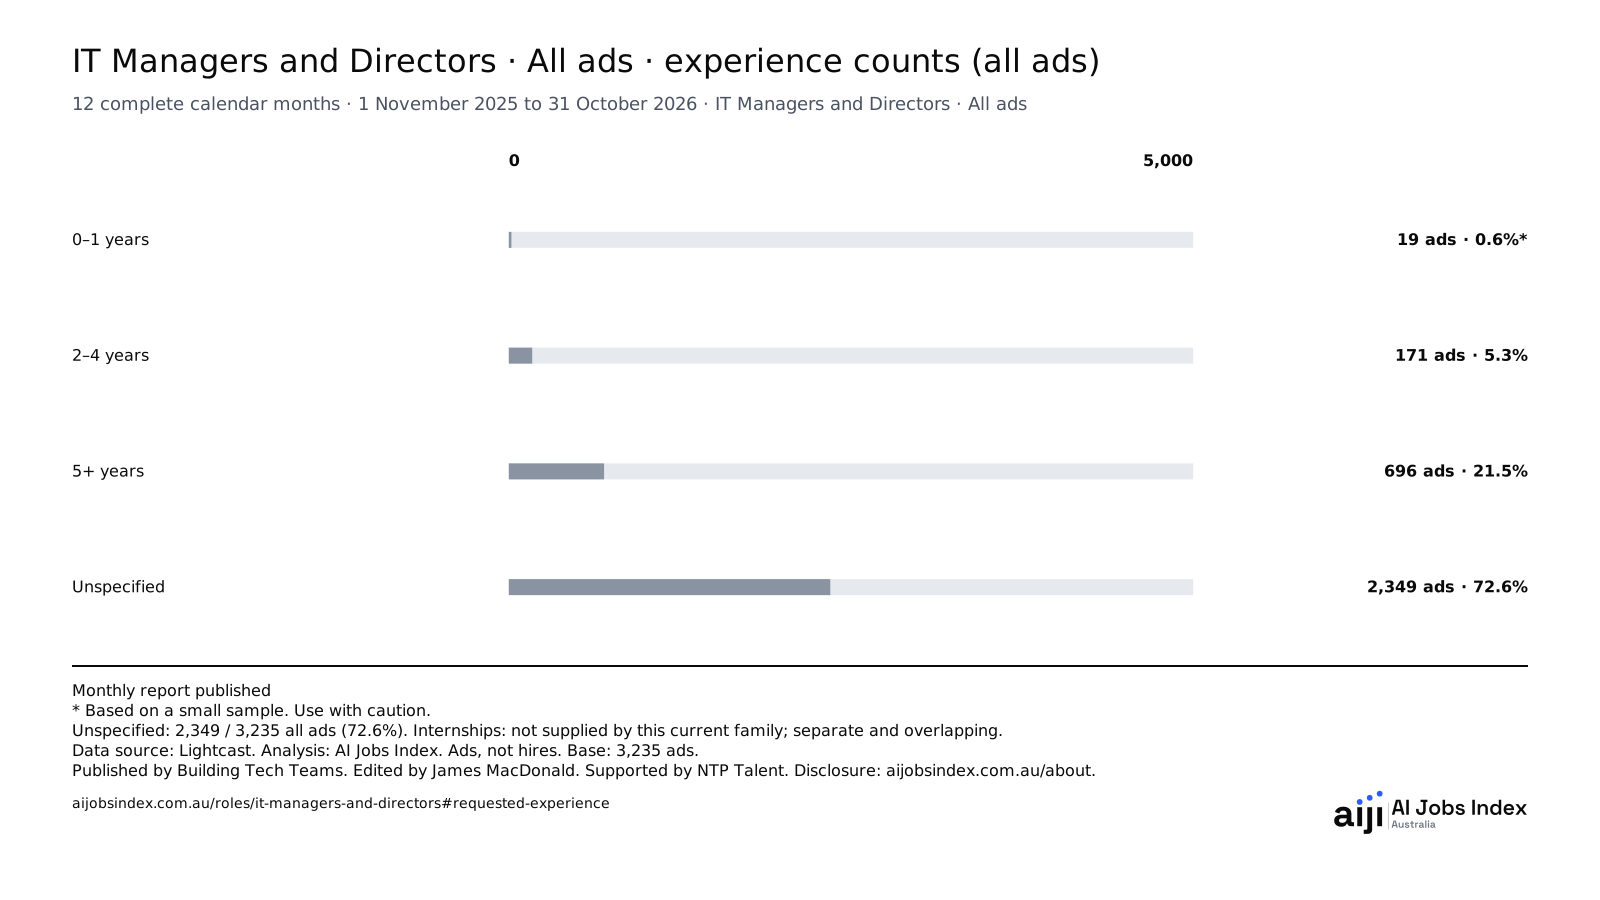
The most common stated experience range in IT Managers and Directors ads was five or more years, appearing in 696 job ads. 2,349 job ads did not state a minimum.
Last 12 months, finishing October 2026. Data source: Lightcast.
Counts and percentages use all ads, including ads with no experience stated.
Each bar label shows the count and its share of all ads.
* Based on a small sample. Use with caution.
| Entry | Reading and base |
|---|---|
| 0–1 years | 19* 0.6%* of all ads (3,235 ads). |
| 2–4 years | 171 5.3% of all ads (3,235 ads). |
| 5+ years | 696 21.5% of all ads (3,235 ads). |
| Unspecified | 2,349 72.6% of all ads (3,235 ads). |
* Based on a small sample. Use with caution.
IT Managers and Directors is Lightcast’s IT Manager / Director occupation. It contains four specialised occupations: IT Manager, Technical Manager / Director, IT Operations / Networking Manager and IT Director.
Exact dated population. Advertisements are not hires. Unspecified experience uses the separate count of all job ads: 2,349 / 3,235 advertisements (72.6%). Internships are not supplied by this current experience family; no count or share is inferred. Internships can overlap the bands and are not an additional partition.
Citation
AI Jobs Index Australia. IT Managers and Directors · All ads · experience counts (all ads). IT Managers and Directors · All ads. Period: 12 complete calendar months · 1 November 2025 to 31 October 2026. Validated refresh 19 November 2026. Accessed 20 November 2026. Data source: Lightcast. Observed postings through 17 November 2026. Source delivery 19 November 2026. Published by Building Tech Teams. https://www.aijobsindex.com.au/roles/it-managers-and-directors#requested-experience
08
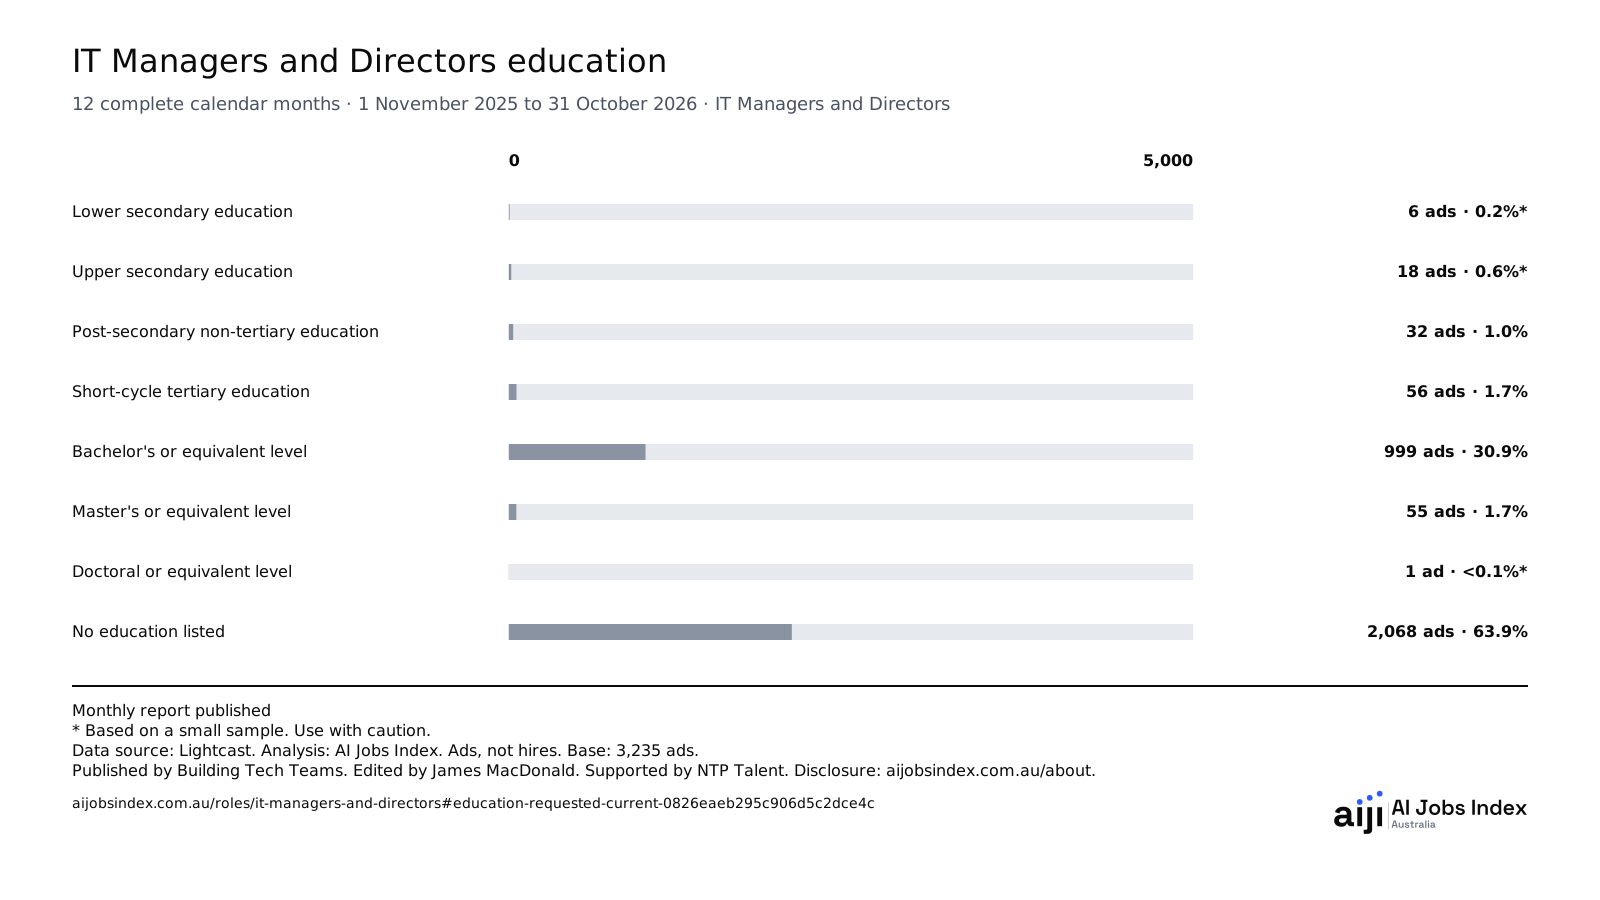
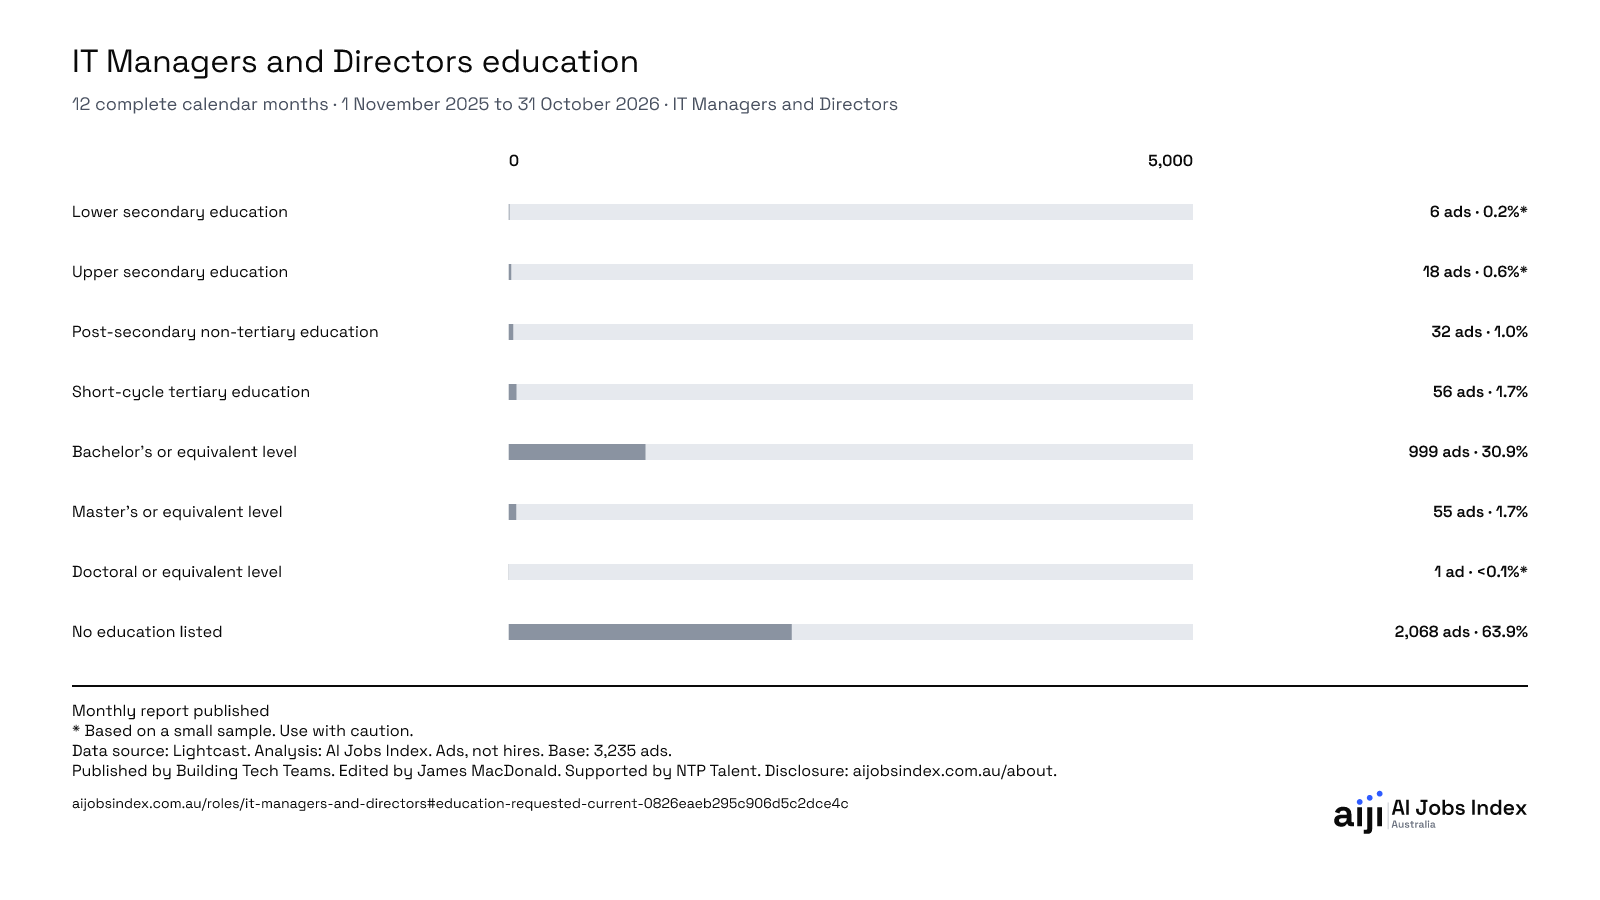
Bachelor's or equivalent level was the most requested education level in IT Managers and Directors ads, appearing in 999 job ads. 2,068 job ads did not state an education requirement.
Last 12 months, finishing October 2026. Data source: Lightcast.
Each bar label shows the count and its share of all ads.
* Based on a small sample. Use with caution.
| Entry | Reading and base |
|---|---|
| Lower secondary education | 6* Distinct advertisement count |
| Upper secondary education | 18* Distinct advertisement count |
| Post-secondary non-tertiary education | 32 Distinct advertisement count |
| Short-cycle tertiary education | 56 Distinct advertisement count |
| Bachelor's or equivalent level | 999 Distinct advertisement count |
| Master's or equivalent level | 55 Distinct advertisement count |
| Doctoral or equivalent level | 1* Distinct advertisement count |
| No education listed | 2,068 Distinct advertisement count |
* Based on a small sample. Use with caution.
IT Managers and Directors is Lightcast’s IT Manager / Director occupation. It contains four specialised occupations: IT Manager, Technical Manager / Director, IT Operations / Networking Manager and IT Director.
Exact dated population. Advertisements are not hires.
Citation
AI Jobs Index Australia. IT Managers and Directors education. IT Managers and Directors. Period: 12 complete calendar months · 1 November 2025 to 31 October 2026. Validated refresh 19 November 2026. Accessed 20 November 2026. Data source: Lightcast. Observed postings through 17 November 2026. Source delivery 19 November 2026. Published by Building Tech Teams. https://www.aijobsindex.com.au/roles/it-managers-and-directors#education-requested-current-0826eaeb295c906d5c2dce4c
Lowest recorded education level, not the education of the person hired. Employers may ask for qualifications that were not recorded. No recorded qualification does not mean none was requested.
| Category | Advertisements | Share of all advertisements |
|---|---|---|
| Lower secondary education | 6* | 0.2%* |
| Upper secondary education | 18* | 0.6%* |
| Post-secondary non-tertiary education | 32 | 1.0% |
| Short-cycle tertiary education | 56 | 1.7% |
| Bachelor's or equivalent level | 999 | 30.9% |
| Master's or equivalent level | 55 | 1.7% |
| Doctoral or equivalent level | 1* | <0.1%* |
| No education listed | 2,068 | 63.9% |
| Unspecified | 0 | 0.0% |
09
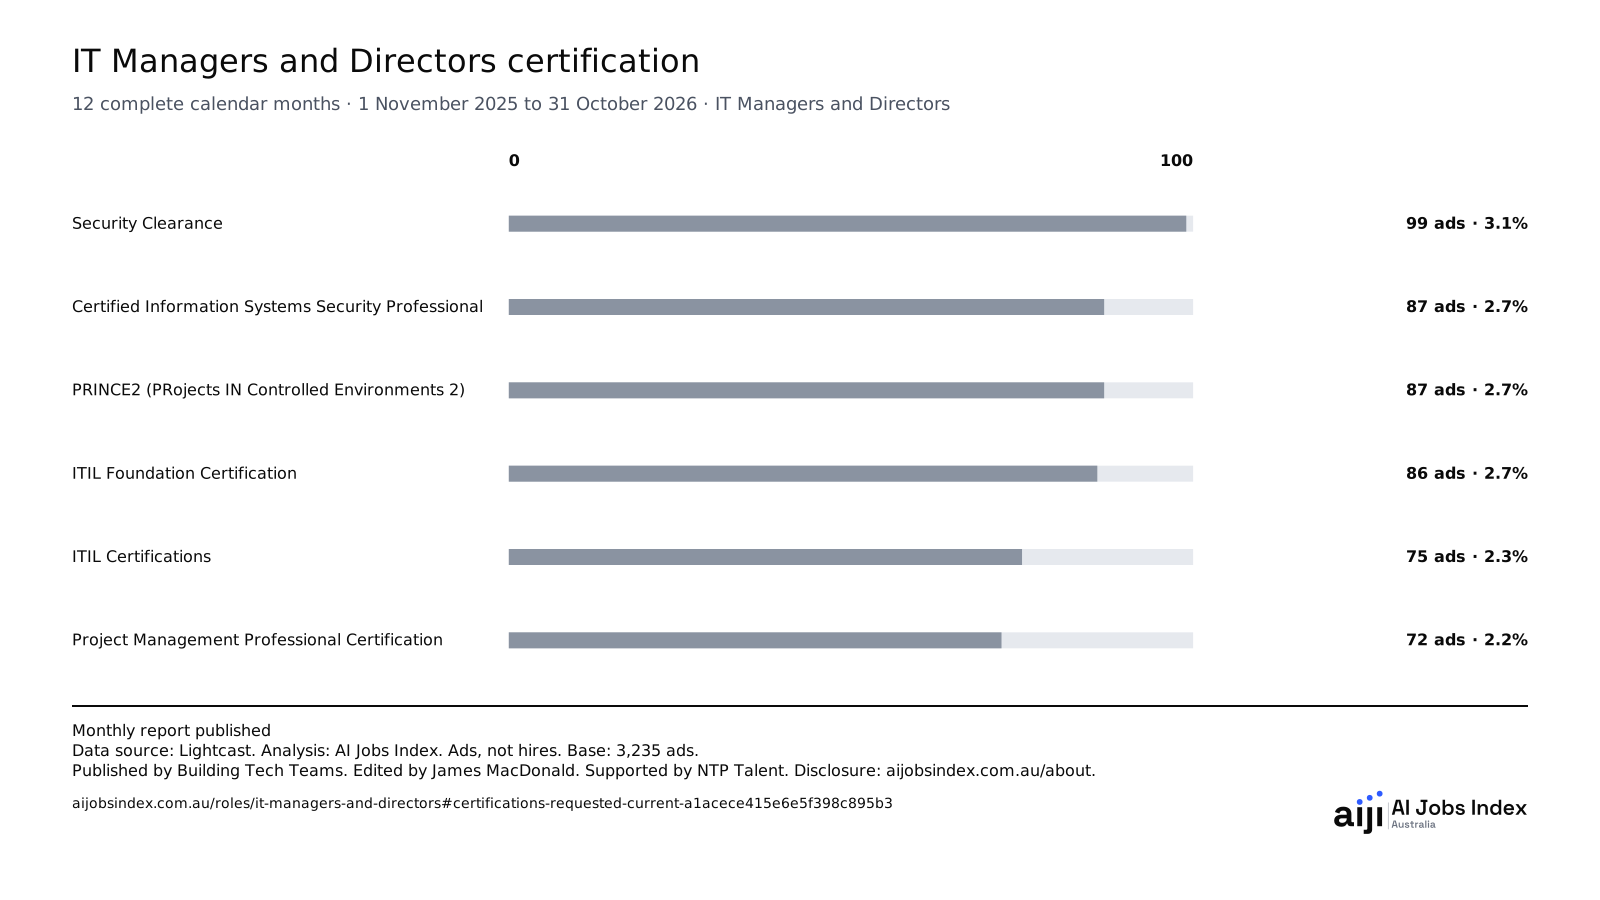
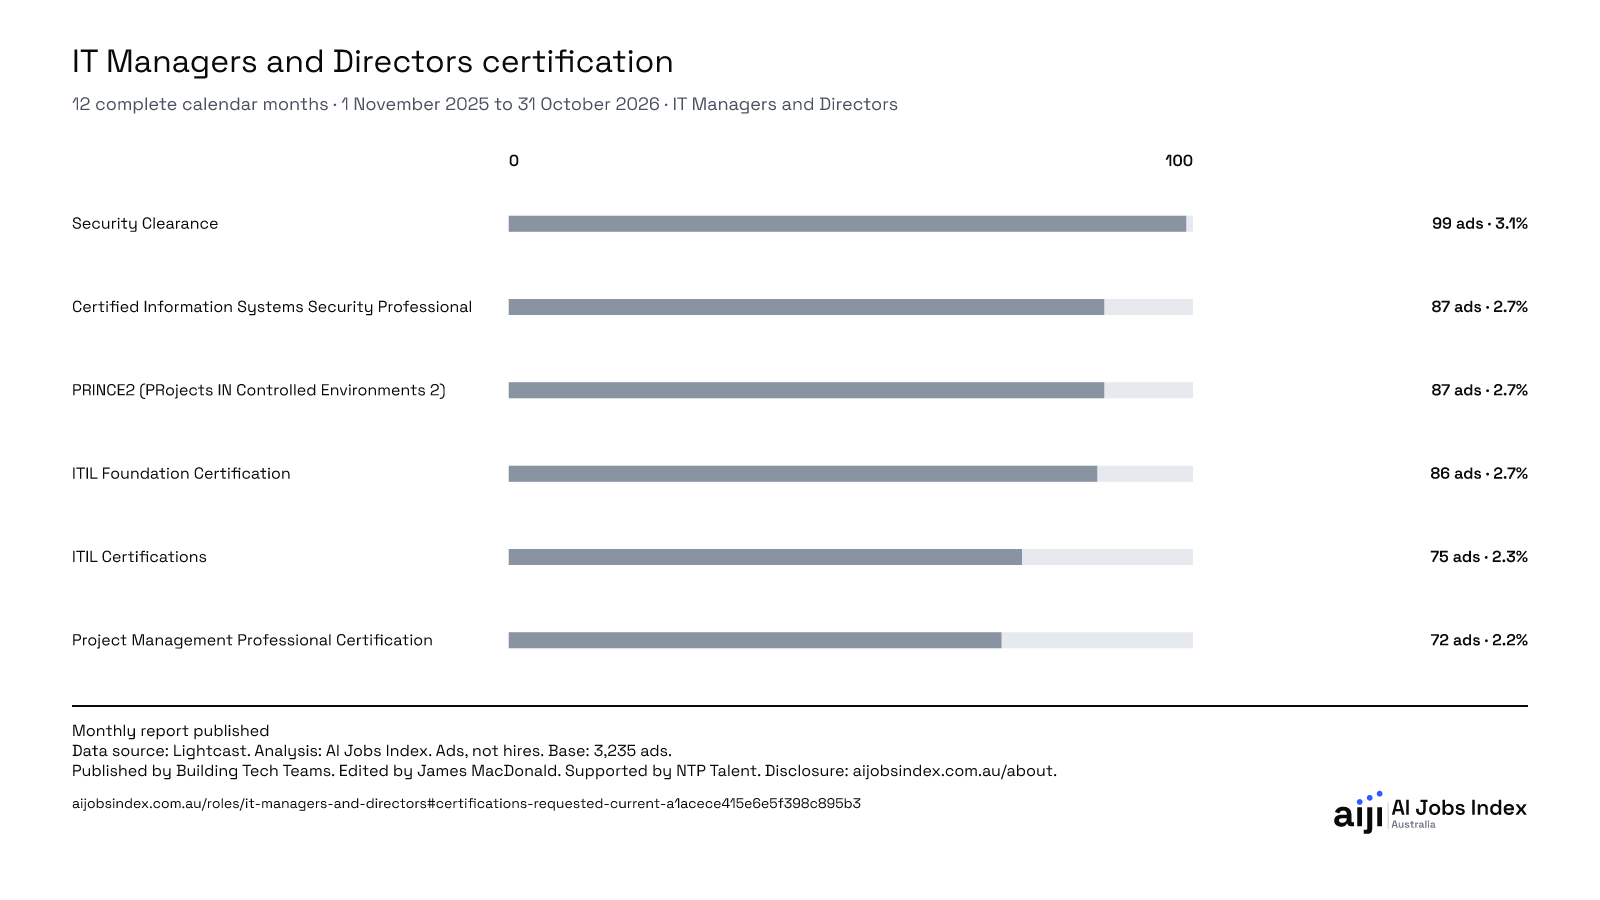
Security Clearance was the most frequently listed certification, appearing in 99 IT Managers and Directors ads. 2,544 ads recorded no certification.
Last 12 months, finishing October 2026. Data source: Lightcast.
An ad can name more than one certification.
Each bar label shows the count and its share of all ads.
| Entry | Reading and base |
|---|---|
| Security Clearance | 99 Distinct advertisement count |
| Certified Information Systems Security Professional | 87 Distinct advertisement count |
| PRINCE2 (PRojects IN Controlled Environments 2) | 87 Distinct advertisement count |
| ITIL Foundation Certification | 86 Distinct advertisement count |
| ITIL Certifications | 75 Distinct advertisement count |
| Project Management Professional Certification | 72 Distinct advertisement count |
IT Managers and Directors is Lightcast’s IT Manager / Director occupation. It contains four specialised occupations: IT Manager, Technical Manager / Director, IT Operations / Networking Manager and IT Director.
Up to six named certifications, ranked by ad count. Data and citation includes the full list and ads with no recorded certification. Exact dated population. Advertisements are not hires.
Citation
AI Jobs Index Australia. IT Managers and Directors certification. IT Managers and Directors. Period: 12 complete calendar months · 1 November 2025 to 31 October 2026. Validated refresh 19 November 2026. Accessed 20 November 2026. Data source: Lightcast. Observed postings through 17 November 2026. Source delivery 19 November 2026. Published by Building Tech Teams. https://www.aijobsindex.com.au/roles/it-managers-and-directors#certifications-requested-current-a1acece415e6e5f398c895b3
An ad can name more than one certification. Employers may ask for qualifications that were not recorded. No recorded qualification does not mean none was requested.
* Based on a small sample. Use with caution.
| Category | Advertisements | Share of all advertisements |
|---|---|---|
| Certified SAFe Scrum Master | 1* | <0.1%* |
| Certified Information System Auditor (CISA) | 68 | 2.1% |
| Microsoft Azure Certification | 5* | 0.2%* |
| ITIL Intermediate Certification | 5* | 0.2%* |
| Certified Software Asset Manager (CSAM) | 2* | <0.1%* |
| Microsoft Certified: Dynamics 365 Fundamentals (CRM) | 1* | <0.1%* |
| Certified Hardware Asset Management Professional (CHAMP) | 1* | <0.1%* |
| Working with Children Check (WWCC) | 48 | 1.5% |
| Microsoft 365 Certified Administrator Expert | 2* | <0.1%* |
| ITIL Foundation Certification | 86 | 2.7% |
| Construction White Card | 2* | <0.1%* |
| PMI Professional in Business Analysis | 2* | <0.1%* |
| ITIL Practitioner Certification | 4* | 0.1%* |
| ServiceNow Certified System Administrator (CSA) | 1* | <0.1%* |
| Six Sigma Certification | 1* | <0.1%* |
| GIAC Information Security Fundamentals | 1* | <0.1%* |
| VMware Certification | 5* | 0.2%* |
| ServiceNow Certified Implementation Specialist (CIS) | 2* | <0.1%* |
| Aruba Certified Switching Professional (ACSP) | 1* | <0.1%* |
| Certified Cloud Security Professional (CCSP) | 1* | <0.1%* |
| Certified Application Developer | 3* | <0.1%* |
| Hazard Analysis And Critical Control Point (HACCP) Certification | 1* | <0.1%* |
| ServiceNow Certified Technical Architect (CTA) | 4* | 0.1%* |
| Certified Data Privacy Solutions Engineer (CDPSE) | 1* | <0.1%* |
| NIST Cybersecurity Framework (CSF) | 15* | 0.5%* |
| Australian Health Practitioner Registration Agency | 1* | <0.1%* |
| Salesforce Certification | 1* | <0.1%* |
| Cisco Certified Network Professional (CCNP) Enterprise | 3* | <0.1%* |
| Microsoft Certified: Azure Developer Associate | 1* | <0.1%* |
| ITIL Expert Certification | 2* | <0.1%* |
| Cardiopulmonary Resuscitation (CPR) Certification | 2* | <0.1%* |
| CompTIA Certification | 13* | 0.4%* |
| Agile Certification | 6* | 0.2%* |
| Red Hat Certified System Administrator (RHCSA) | 2* | <0.1%* |
| First Aid Certification | 7* | 0.2%* |
| Certified Information Privacy Professional | 2* | <0.1%* |
| Project Management Certification | 41 | 1.3% |
| ServiceNow Certified Master Architect (CMA) | 1* | <0.1%* |
| Forklift Certification | 1* | <0.1%* |
| TOGAF Certification | 1* | <0.1%* |
| Certified Data Centre Professional | 2* | <0.1%* |
| CDL Class C License | 1* | <0.1%* |
| Architecture License | 1* | <0.1%* |
| Valid Driver's License | 22* | 0.7%* |
| Microsoft Certified: Azure Solutions Architect Expert | 3* | <0.1%* |
| SAP Certification | 1* | <0.1%* |
| Microsoft Certified: Azure Administrator Associate | 1* | <0.1%* |
| Registered Pharmacist (RPh) | 1* | <0.1%* |
| Adobe Certified Expert | 1* | <0.1%* |
| Apple Certified Support Professional | 1* | <0.1%* |
| American Society For Quality (ASQ) Certified | 2* | <0.1%* |
| Basic Cardiac Life Support | 1* | <0.1%* |
| Certified Business Analysis Professional | 4* | 0.1%* |
| Certified Business Manager | 2* | <0.1%* |
| Cisco Certified Internetwork Expert | 14* | 0.4%* |
| Cisco Certified Network Associate | 31 | 1.0% |
| Cisco Certified Network Professional | 25* | 0.8%* |
| Certified Business Continuity Professional | 6* | 0.2%* |
| Certified Fraud Examiner | 1* | <0.1%* |
| Certified Information Systems Security Professional | 87 | 2.7% |
| Certified Information Security Manager | 58 | 1.8% |
| Certified Internal Auditor | 27* | 0.8%* |
| Certified Practising Accountant | 8* | 0.2%* |
| PMI Agile Certified Practitioner | 9* | 0.3%* |
| Certified Public Accountant | 16* | 0.5%* |
| Chartered Financial Analyst | 4* | 0.1%* |
| Certified In The Governance Of Enterprise IT | 5* | 0.2%* |
| Change Management Certification | 2* | <0.1%* |
| Chartered Accountant | 7* | 0.2%* |
| Cisco Certified Entry Network Technician | 2* | <0.1%* |
| CompTIA A+ | 2* | <0.1%* |
| CompTIA Network+ | 5* | 0.2%* |
| CompTIA Security+ | 10* | 0.3%* |
| Certified In Risk And Information Systems Control | 27* | 0.8%* |
| Certified Scrum Product Owner | 2* | <0.1%* |
| Certified Chief Information Security Officer | 1* | <0.1%* |
| GIAC Certifications | 1* | <0.1%* |
| International Institute Of Business Analysis (IIBA) Certified | 1* | <0.1%* |
| Information Technology Certified Professional | 1* | <0.1%* |
| ITIL Certifications | 75 | 2.3% |
| Juniper Networks Certified Internet Associate | 3* | <0.1%* |
| Juniper Network Certified Internet Professional (JNCIP) | 3* | <0.1%* |
| Juniper Networks Certified Internet Specialist | 2* | <0.1%* |
| Microsoft Certified Professional | 42 | 1.3% |
| Microsoft Certified Solution Developer (MCSD) | 1* | <0.1%* |
| Microsoft Certified Systems Engineer | 9* | 0.3%* |
| Microsoft Certified Solutions Expert | 2* | <0.1%* |
| Project Management Professional Certification | 72 | 2.2% |
| PRINCE2 (PRojects IN Controlled Environments 2) | 87 | 2.7% |
| Product Certification | 1* | <0.1%* |
| VMware Certified Professional (VCP) | 1* | <0.1%* |
| Security Clearance | 99 | 3.1% |
| Certified Secure Software Lifecycle Professional | 1* | <0.1%* |
| Linux Certified Instructor | 1* | <0.1%* |
| Master Of Business Administration (MBA) | 29* | 0.9%* |
| Association Of Chartered Certified Accountants | 2* | <0.1%* |
| Certified Scrum Master | 6* | 0.2%* |
| Institute Of Internal Auditors (IIA) | 15* | 0.5%* |
| Certified Disability Management Specialist | 3* | <0.1%* |
| Top Secret-Sensitive Compartmented Information (TS/SCI Clearance) | 9* | 0.3%* |
| No certification recorded | 2,544 | 78.6% |
10
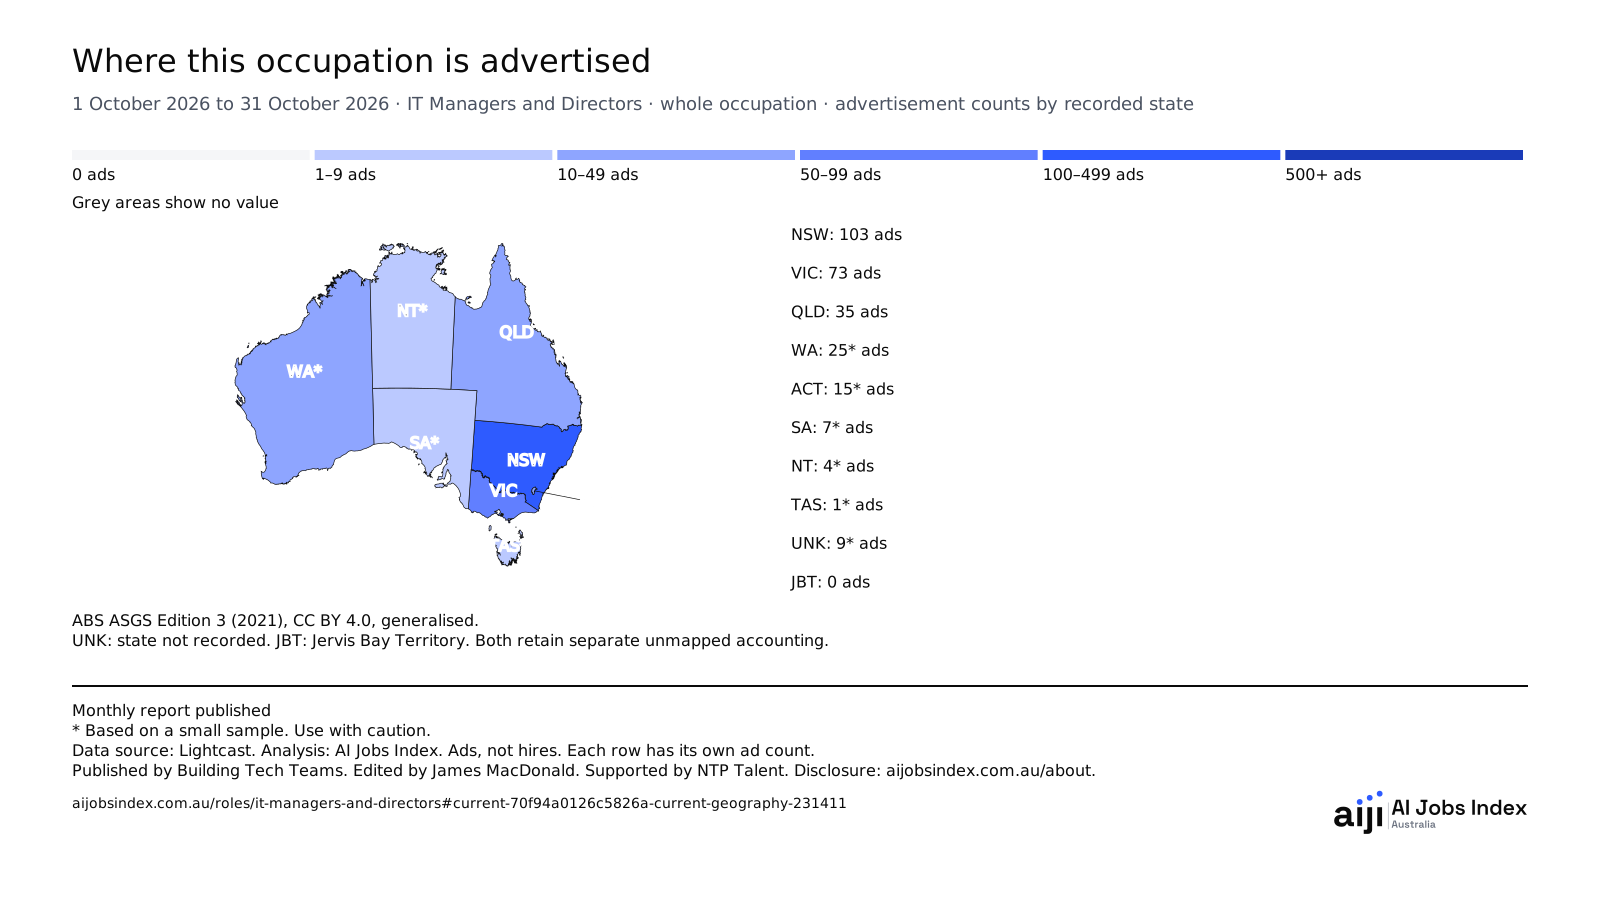
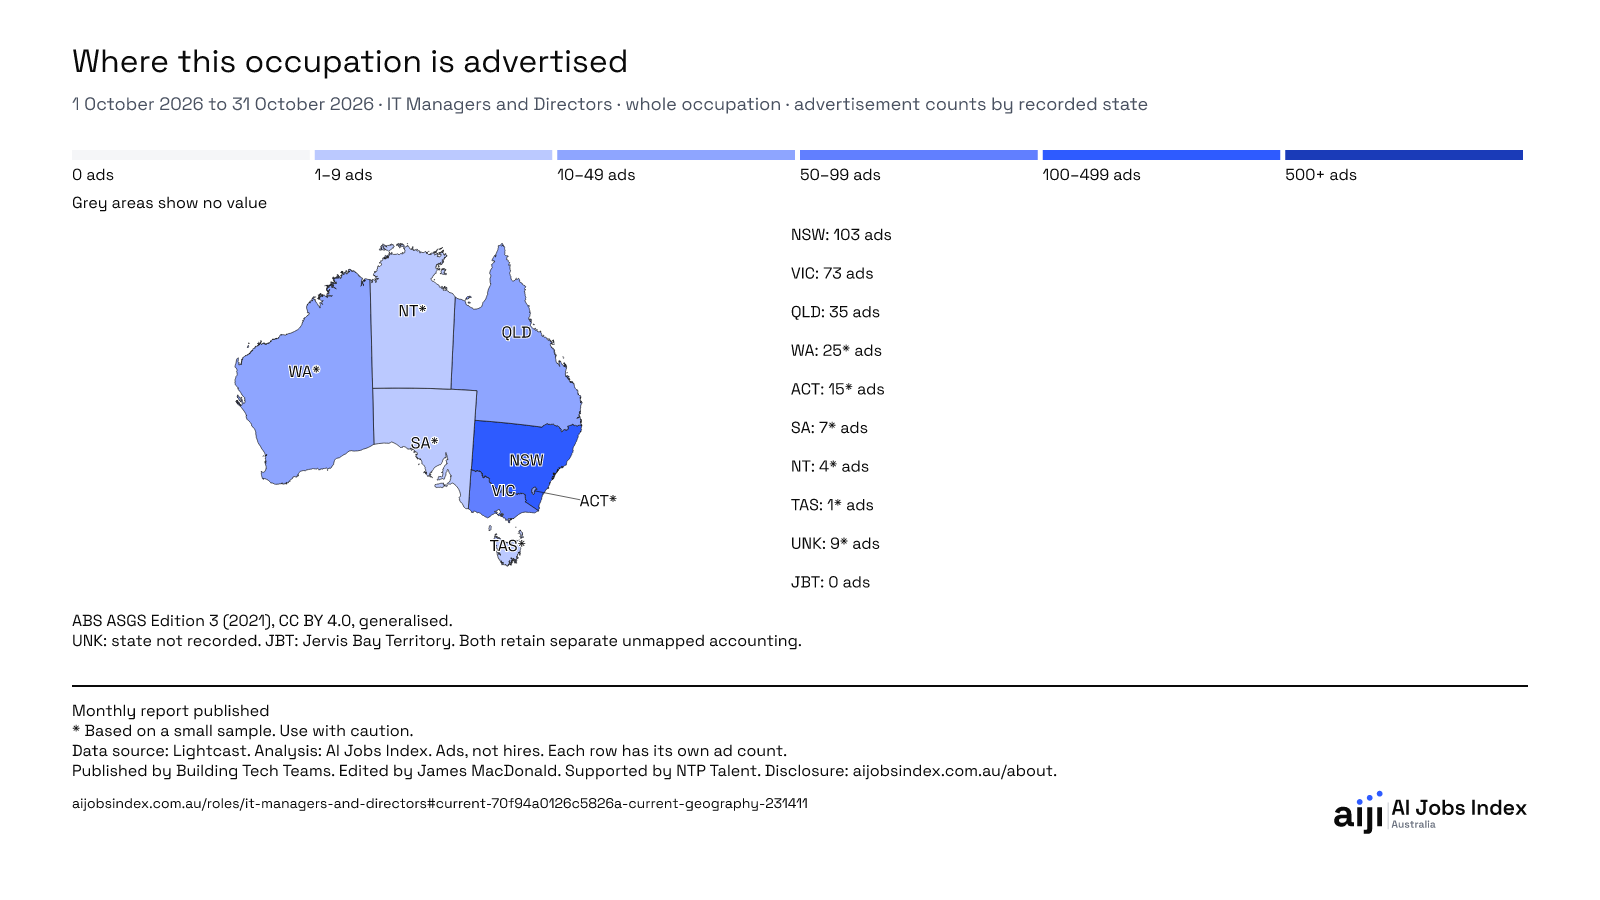
New South Wales had the most IT Managers and Directors ads in October 2026, with 103.
IT Managers and Directors job ads. October 2026. Data source: Lightcast.
All IT Managers and Directors job ads by recorded state or territory.
Map boundaries: ABS ASGS Edition 3 (2021), CC BY 4.0, generalised.
* Based on a small sample. Use with caution.
| Recorded location | Job ads |
|---|---|
| New South Wales | 103 |
| Victoria | 73 |
| Queensland | 35 |
| Western Australia | 25* |
| Australian Capital Territory | 15* |
| South Australia | 7* |
| Northern Territory | 4* |
| Tasmania | 1* |
| State not recorded Unmapped accounting | 9* |
| Jervis Bay Territory Unmapped accounting | 0 |
* Based on a small sample. Use with caution.
IT Managers and Directors is Lightcast’s IT Manager / Director occupation. It contains four specialised occupations: IT Manager, Technical Manager / Director, IT Operations / Networking Manager and IT Director.
ABS ASGS Edition 3 (2021), CC BY 4.0, generalised. Unknown state and Jervis Bay retain separate unmapped accounting.
Location definitions and accounting. Unmapped locations stay in the evidence table.
Citation
AI Jobs Index Australia. Where this occupation is advertised. IT Managers and Directors · whole occupation · advertisement counts by recorded state. Period: 1 October 2026 to 31 October 2026. Validated refresh 19 November 2026. Accessed 20 November 2026. Data source: Lightcast. Observed postings through 17 November 2026. Source delivery 19 November 2026. Published by Building Tech Teams. https://www.aijobsindex.com.au/roles/it-managers-and-directors#current-70f94a0126c5826a-current-geography-231411
Latest full calendar month. Missing or protected readings stay on this month, not an earlier map. Location definitions and accounting are in Methodology.
All-ad base: 15*. Without recorded skills: 0.
All-ad base: 0. Without recorded skills: 0.
All-ad base: 103. Without recorded skills: 0.
All-ad base: 4*. Without recorded skills: 0.
All-ad base: 35. Without recorded skills: 0.
All-ad base: 7*. Without recorded skills: 0.
All-ad base: 1*. Without recorded skills: 0.
All-ad base: 9*. Without recorded skills: 0.
All-ad base: 73. Without recorded skills: 0.
All-ad base: 25*. Without recorded skills: 0.
11
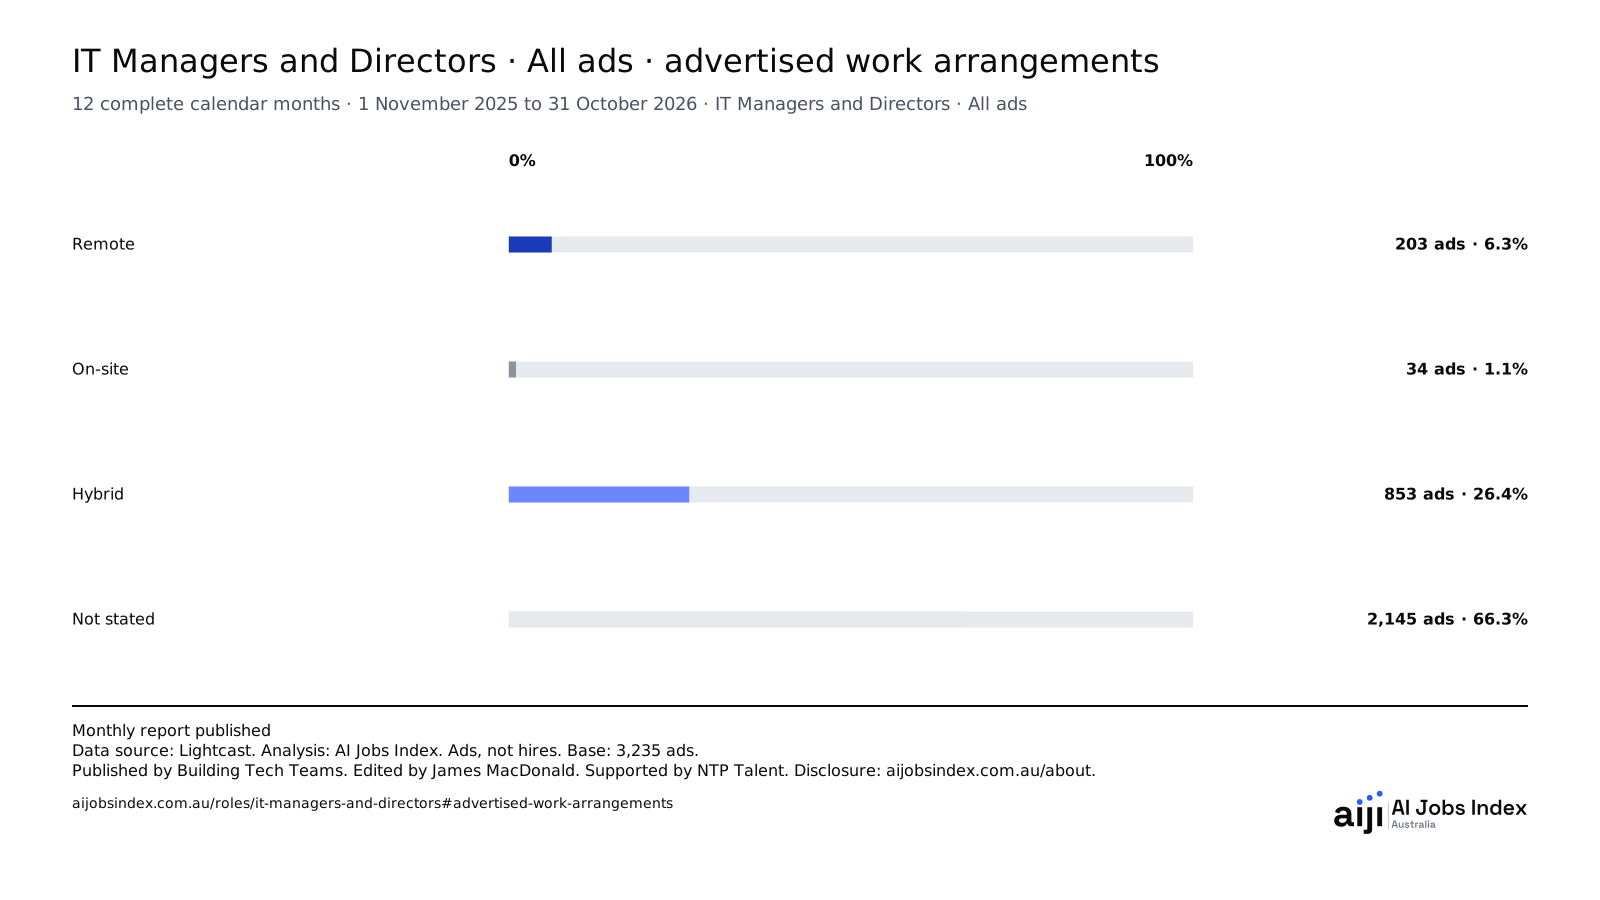
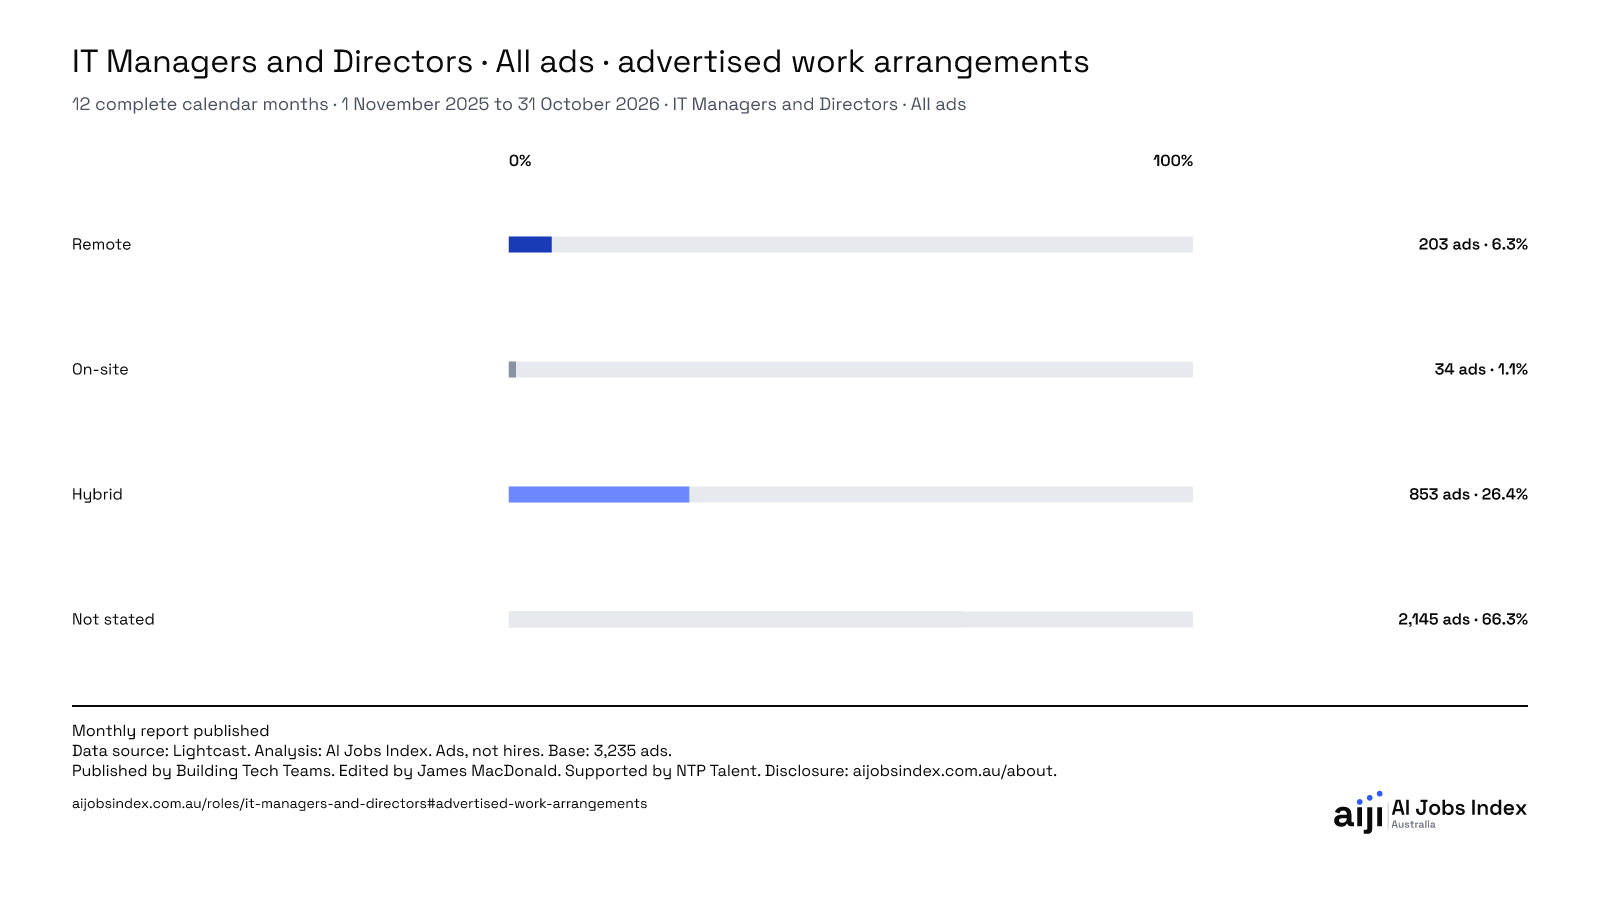
26.4% of IT Managers and Directors ads advertised hybrid work and 6.3% advertised remote work. 66.3% did not state an arrangement.
Last 12 months, finishing October 2026. Data source: Lightcast.
Ads that do not state an arrangement are counted separately from on-site ads.
Each bar label shows the count and its share of all ads.
| Entry | Reading and base |
|---|---|
| Remote | 6.3% 203 / 3,235 all ads |
| On-site | 1.1% 34 / 3,235 all ads |
| Hybrid | 26.4% 853 / 3,235 all ads |
| Not stated | 66.3% 2,145 / 3,235 all ads |
IT Managers and Directors is Lightcast’s IT Manager / Director occupation. It contains four specialised occupations: IT Manager, Technical Manager / Director, IT Operations / Networking Manager and IT Director.
Exact dated population. Advertisements are not hires.
Citation
AI Jobs Index Australia. IT Managers and Directors · All ads · advertised work arrangements. IT Managers and Directors · All ads. Period: 12 complete calendar months · 1 November 2025 to 31 October 2026. Validated refresh 19 November 2026. Accessed 20 November 2026. Data source: Lightcast. Observed postings through 17 November 2026. Source delivery 19 November 2026. Published by Building Tech Teams. https://www.aijobsindex.com.au/roles/it-managers-and-directors#advertised-work-arrangements
Percentages of all job ads in the 12-month window. Ads that do not state an arrangement are counted separately from on-site ads.
* Based on a small sample. Use with caution.
| Category | Advertisements | Share of all advertisements |
|---|---|---|
| Remote | 203 | 6.3% |
| On-site | 34 | 1.1% |
| Hybrid | 853 | 26.4% |
| Not stated | 2,145 | 66.3% |
Ads that do not state an arrangement are counted separately from on-site ads. The source can record an unknown arrangement or leave it blank.
| Category | Advertisements | Share of all advertisements |
|---|---|---|
| Remote | 40 | 11.2% |
| On-site | 1* | 0.3%* |
| Hybrid | 84 | 23.5% |
| Not stated | 232 | 65.0% |
Ads that do not state an arrangement are counted separately from on-site ads. The source can record an unknown arrangement or leave it blank.
| Category | Advertisements | Share of all advertisements |
|---|---|---|
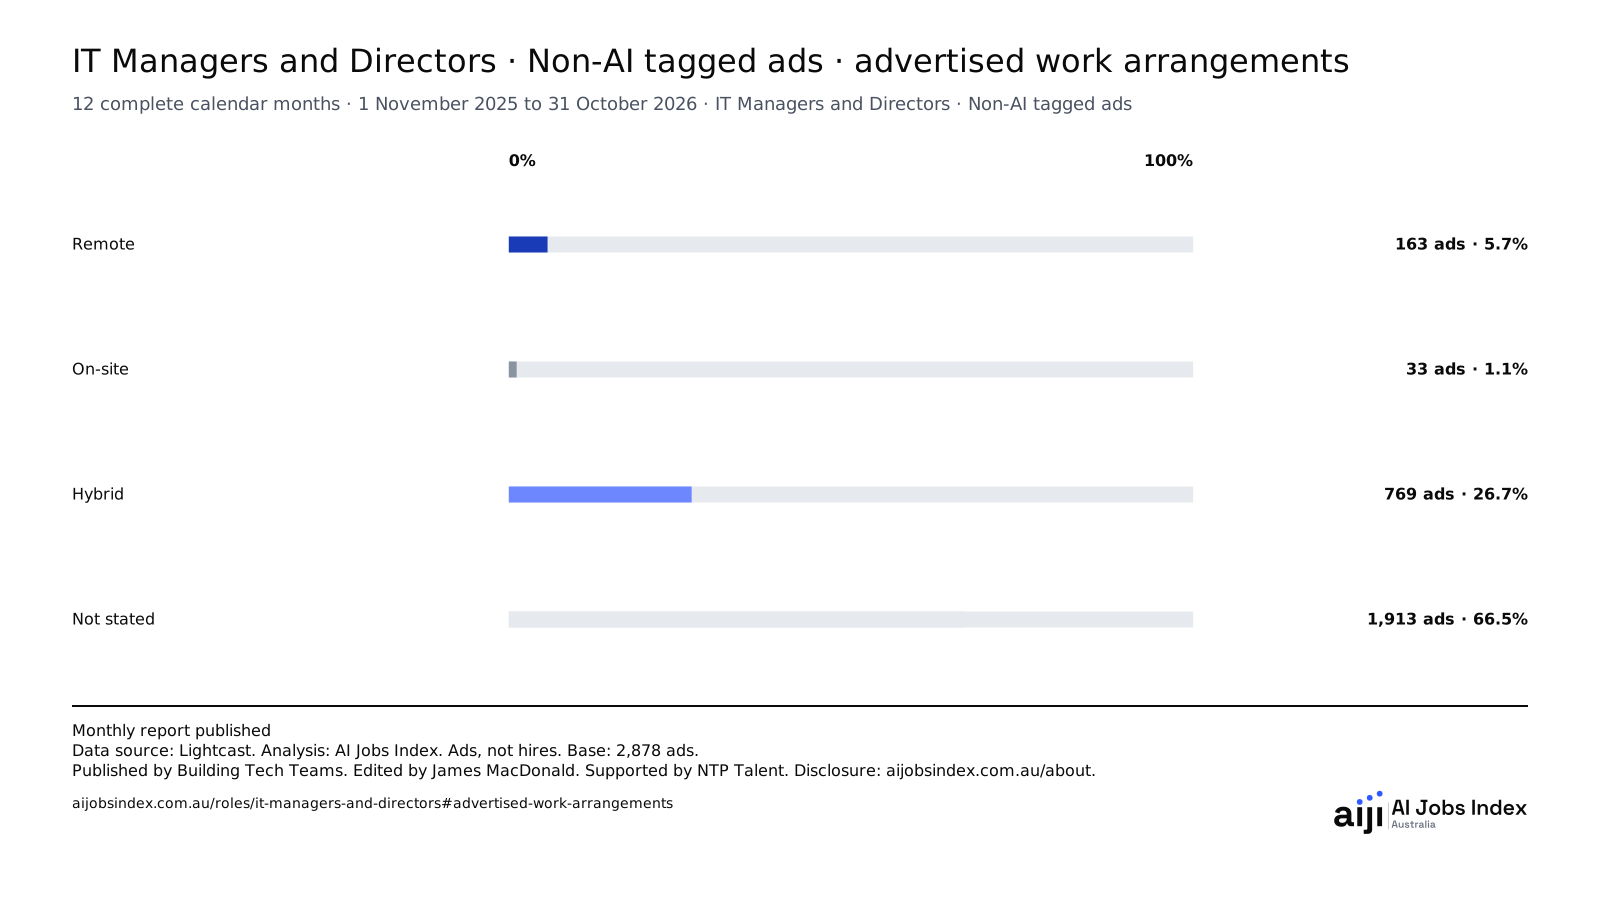
| Remote | 163 | 5.7% |
| On-site | 33 | 1.1% |
| Hybrid | 769 | 26.7% |
| Not stated | 1,913 | 66.5% |
Ads that do not state an arrangement are counted separately from on-site ads. The source can record an unknown arrangement or leave it blank.
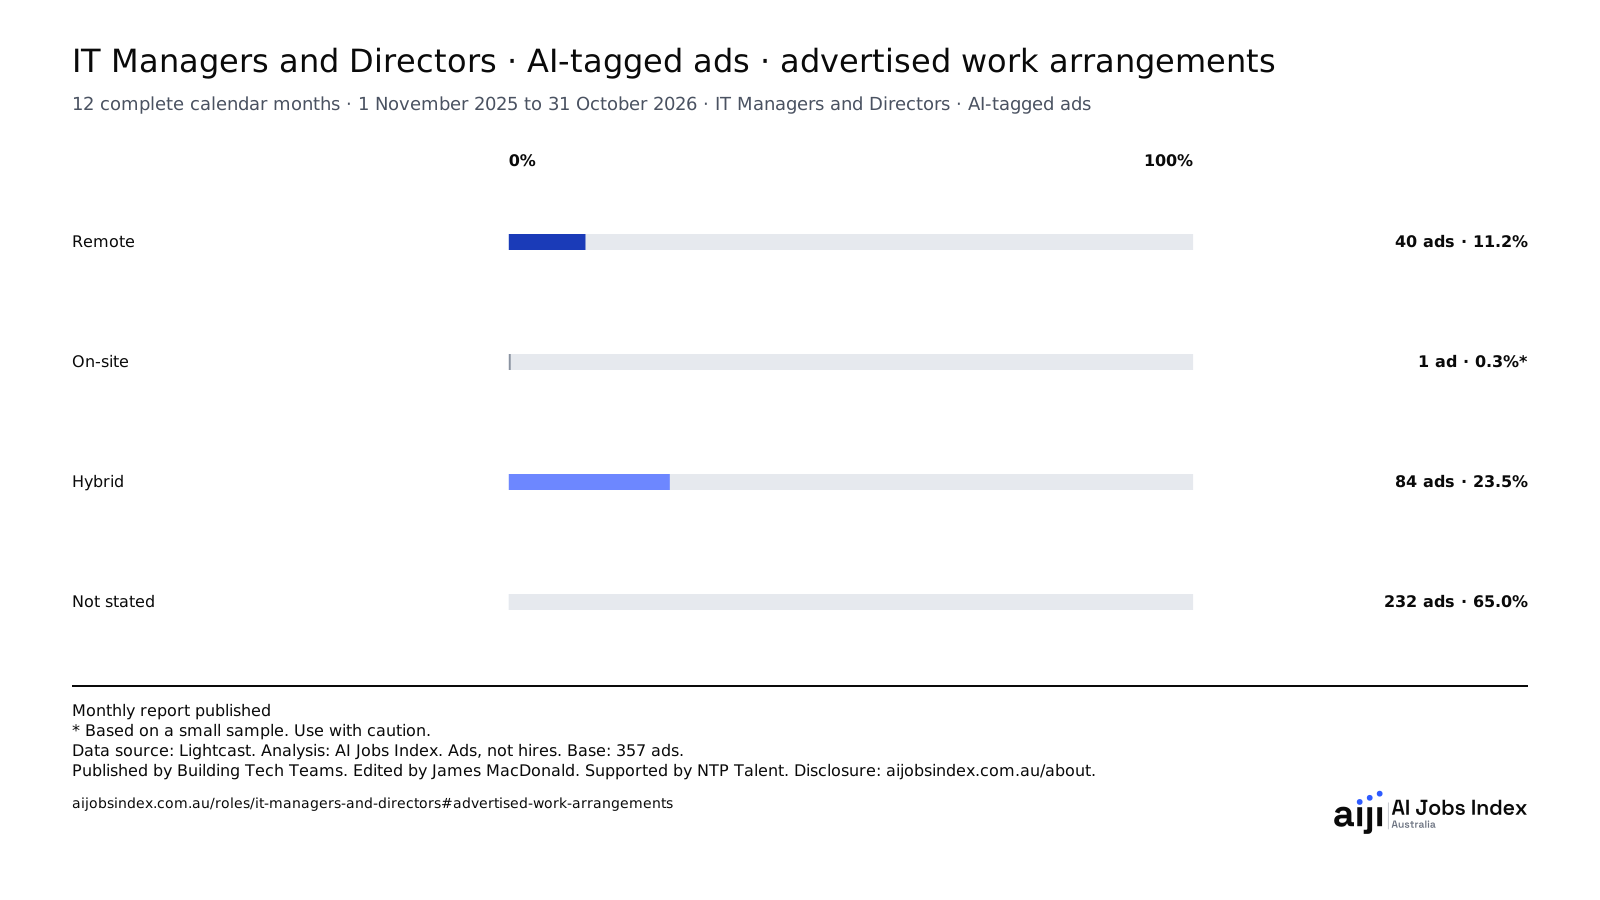
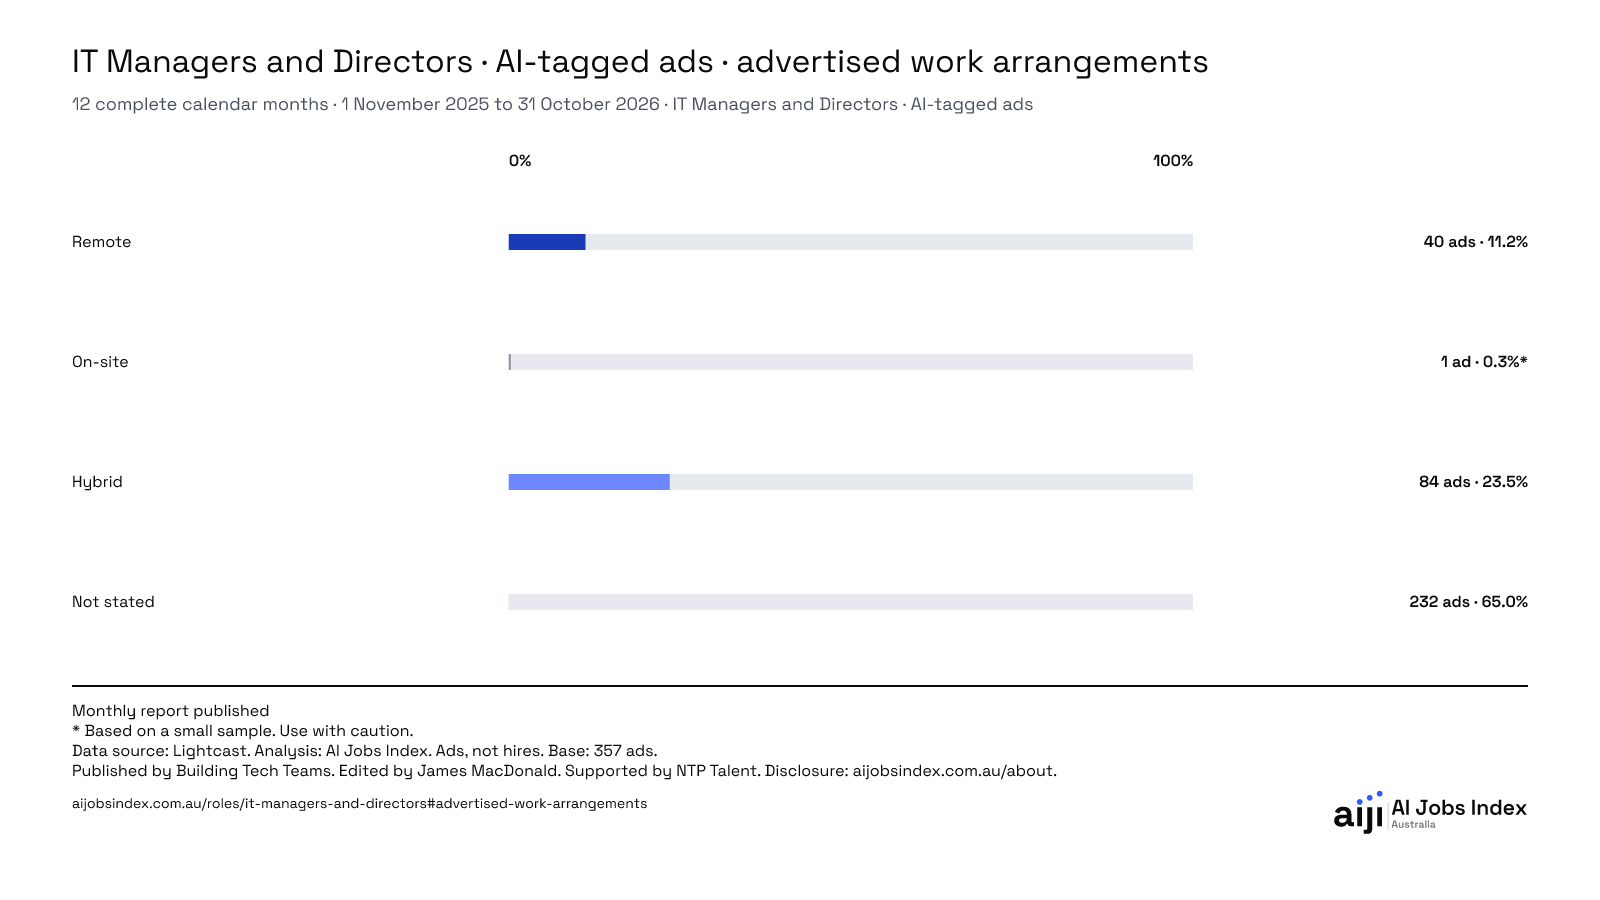
23.5% of IT Managers and Directors ads naming an AI skill advertised hybrid work and 11.2% advertised remote work. 65.0% did not state an arrangement.
Last 12 months, finishing October 2026. Data source: Lightcast.
Ads that do not state an arrangement are counted separately from on-site ads.
Each bar label shows the count and its share of all ads.
* Based on a small sample. Use with caution.
| Entry | Reading and base |
|---|---|
| Remote | 11.2% 40 / 357 all ads |
| On-site | 0.3%* 1 / 357 all ads |
| Hybrid | 23.5% 84 / 357 all ads |
| Not stated | 65.0% 232 / 357 all ads |
* Based on a small sample. Use with caution.
IT Managers and Directors is Lightcast’s IT Manager / Director occupation. It contains four specialised occupations: IT Manager, Technical Manager / Director, IT Operations / Networking Manager and IT Director.
Exact dated population. Advertisements are not hires.
Citation
AI Jobs Index Australia. IT Managers and Directors · AI-tagged ads · advertised work arrangements. IT Managers and Directors · AI-tagged ads. Period: 12 complete calendar months · 1 November 2025 to 31 October 2026. Validated refresh 19 November 2026. Accessed 20 November 2026. Data source: Lightcast. Observed postings through 17 November 2026. Source delivery 19 November 2026. Published by Building Tech Teams. https://www.aijobsindex.com.au/roles/it-managers-and-directors#advertised-work-arrangements
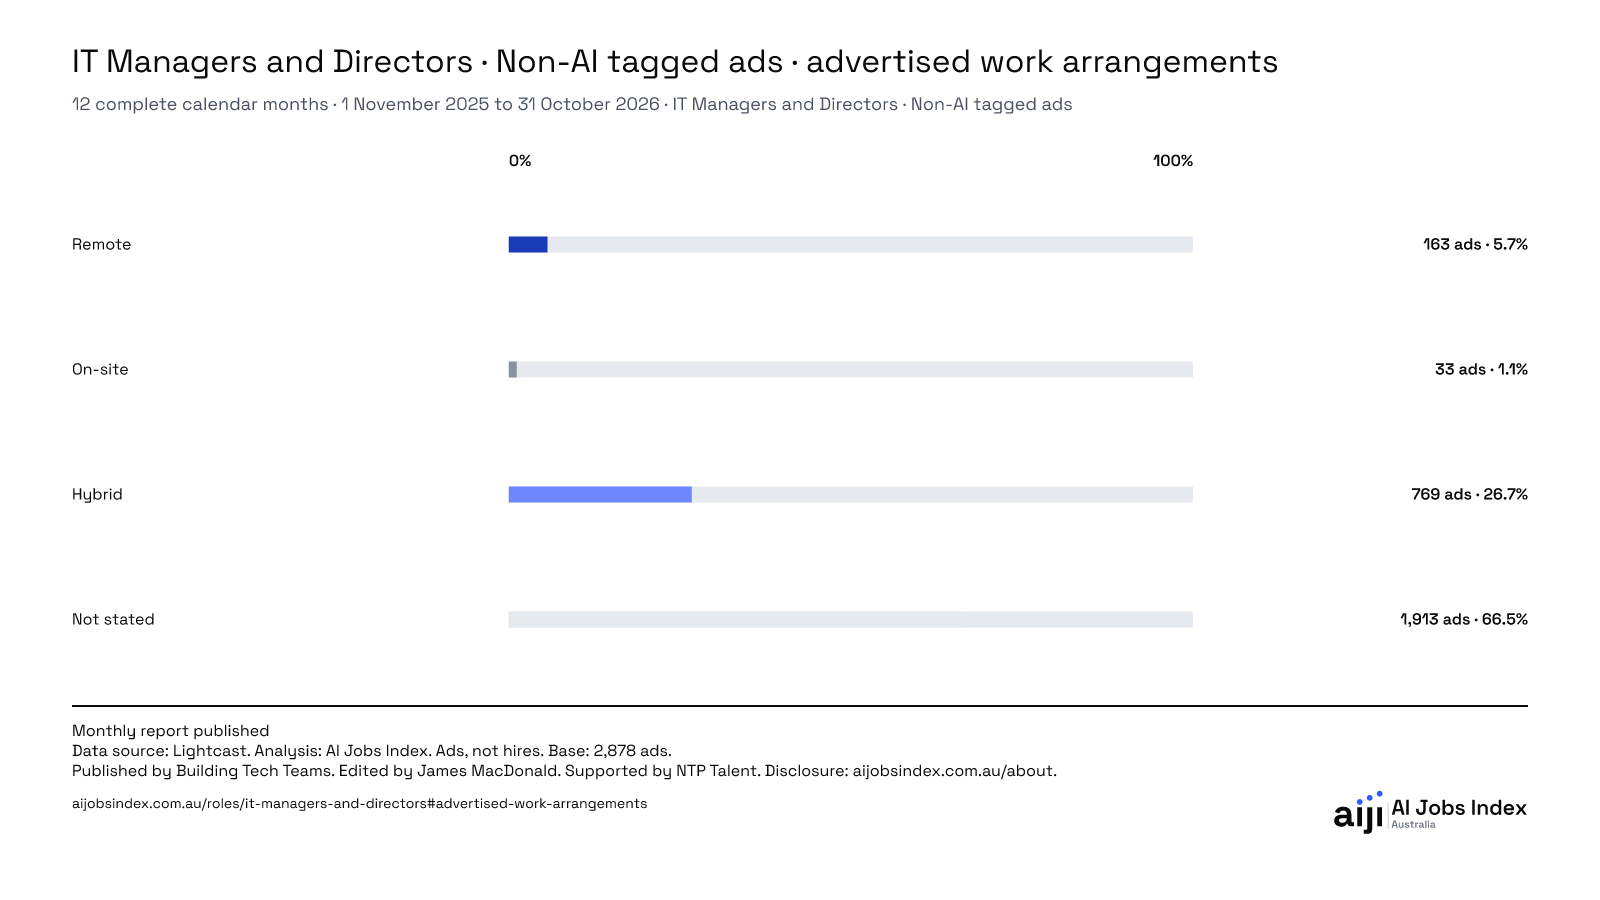
26.7% of IT Managers and Directors ads without a recorded AI skill advertised hybrid work and 5.7% advertised remote work. 66.5% did not state an arrangement.
Last 12 months, finishing October 2026. Data source: Lightcast.
Ads that do not state an arrangement are counted separately from on-site ads.
Each bar label shows the count and its share of all ads.
| Entry | Reading and base |
|---|---|
| Remote | 5.7% 163 / 2,878 all ads |
| On-site | 1.1% 33 / 2,878 all ads |
| Hybrid | 26.7% 769 / 2,878 all ads |
| Not stated | 66.5% 1,913 / 2,878 all ads |
IT Managers and Directors is Lightcast’s IT Manager / Director occupation. It contains four specialised occupations: IT Manager, Technical Manager / Director, IT Operations / Networking Manager and IT Director.
Exact dated population. Advertisements are not hires.
Citation
AI Jobs Index Australia. IT Managers and Directors · Non-AI tagged ads · advertised work arrangements. IT Managers and Directors · Non-AI tagged ads. Period: 12 complete calendar months · 1 November 2025 to 31 October 2026. Validated refresh 19 November 2026. Accessed 20 November 2026. Data source: Lightcast. Observed postings through 17 November 2026. Source delivery 19 November 2026. Published by Building Tech Teams. https://www.aijobsindex.com.au/roles/it-managers-and-directors#advertised-work-arrangements
Each chart is available as an SVG and a PNG. The images include the period, group of ads and data source.